Fig. 5.

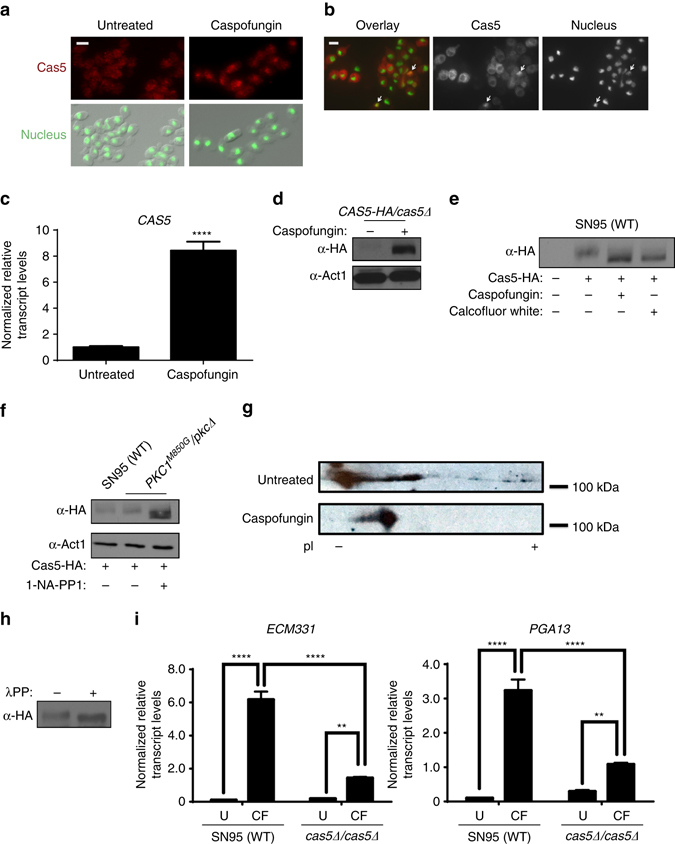
Cas5 becomes activated by dephosphorylation in response to cell wall stress. a Cas5 localizes to the nucleus in response to caspofungin. Cells were fixed and Cas5 (red) was detected by indirect immunofluorescence using α-HA antibody and α-mouse IgG-Cy3. Nuclei (green) were visualized by DAPI staining. Scale bar represents 5 μm. b Cells were subcultured in rich medium to log phase and fixed. HA-tagged Cas5 (red) and nuclei (green) were visualized as in a. Scale bar represents 5 μm. c CAS5 is induced by caspofungin. The transcript level of CAS5 was monitored by qRT-PCR and normalized to GPD1. Error bars represent standard deviation (s.d.) from the mean of triplicate samples. Significance was measured with an unpaired t test in GraphPad Prism (****P < 0.0001). d Levels of Cas5 were monitored by western blot and detected with an α-HA antibody. Actin was detected with an α-β-actin antibody as a loading control. Full blots are shown in Supplementary Fig. 2b. e Cas5 is post-translationally modified upon cell wall stress treatment. Cells were grown to log phase and subsequently treated with 125 ng/ml of caspofungin or 50 μg/ml of calcofluor white for 1 h. Total protein was resolved by SDS-PAGE and the blot was hybridized with an α-HA to monitor Cas5 migration. Full blots are shown in Supplementary Fig. 2c. f Cas5 migration and actin detection were monitored as part d. Full blots are shown in Supplementary Fig. 2d. g Protein lysates were subjected to two-dimensional gel electrophoresis coupled with western blotting. Cas5 was detected with an α-HA antibody. h Cas5 is phosphorylated in the absence of stress. Cas5 migration was monitored by western blot and detected with an α-HA antibody. Treatment of protein lysate with lambda phosphatase resulted in a faster migrating band. Full blots are shown in Supplementary Fig. 2e. i Cas5 is required for caspofungin (CF)-induction of cell wall genes. Transcript levels of ECM331 and PGA13 were monitored by qRT-PCR and normalized to GPD1. Error bars represent s.d. from the mean of triplicate samples. Significance was measured with a Tukey’s multiple comparisons test in GraphPad Prism (****P < 0.0001, **P < 0.01)
