Fig. 9.
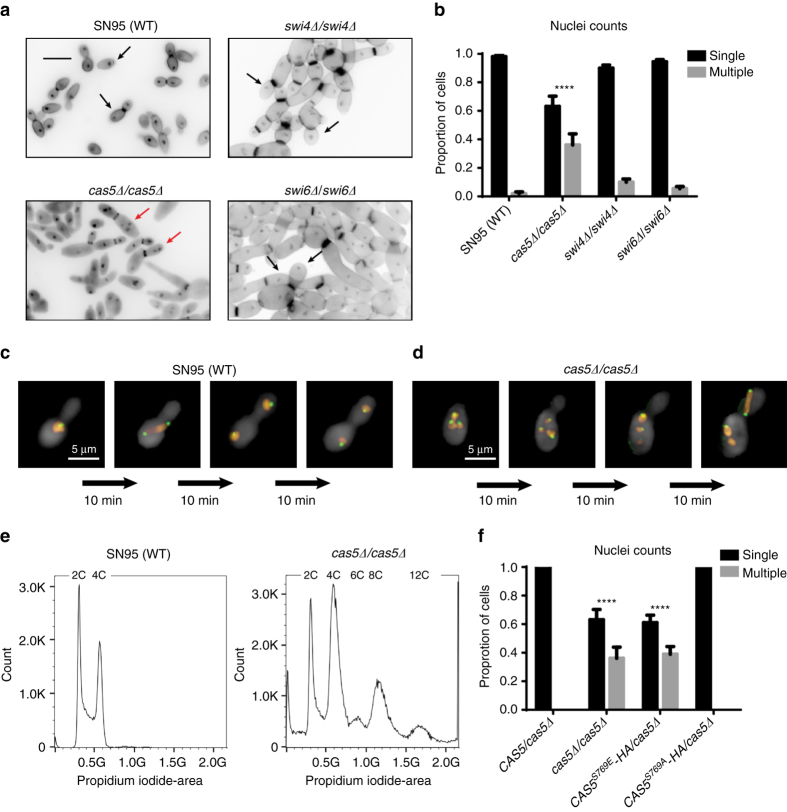
Cas5 regulates nuclear division largely independent of Swi4 and Swi6. a Nuclei were stained with DAPI and chitin was stained using calcofluor white. For each image, 12 Z-stack slices were taken at 0.3 μm each. Black arrows highlight cells with a single nucleus. Red arrows highlight cells with a multinucleated phenotype. b Mutants lacking Cas5 exhibit severe cell cycle defect. The histogram represents the average number of nuclei per cell in three biological replicates. The number of nuclei counted in each experiment was at least 120 cells for each strain. The nuclei counts for each strain were averaged and error bars represent standard deviation (s.d.) from the mean of biological duplicates. Nuclei counts for each strain were compared to the wildtype using one-way ANOVA in GraphPad Prism (****P < 0.0001). c, d Mitotic spindles are aligned along the mother–bud axis during cell division in wild-type cells (c) and misaligned in a mutant lacking Cas5 (d). DNA was monitored by RFP-tagged Hhf1, and mitotic spindle was monitored by GFP-tagged Dad2 using time-lapse fluorescence microscopy. e Cas5 is required for maintaining normal DNA content throughout the cell cycle. Cellular DNA content was measured by propidium iodide and flow cytometry of the wild-type diploid and the cas5Δ/cas5Δ mutant strain. The wild-type diploid has the standard G1 and G2 cell cycle peaks representing 2C and 4C DNA levels. The cas5∆/cas5∆ mutant population, in addition to the same 2C and 4C DNA levels, contained a large subpopulation of cells with DNA levels at 6C, 8C, and 12C. These DNA levels represent tetraploid (4N) and hexaploid (6N) cells. f Activation of Cas5 by dephosphorylation is required for proper cell cycle progression. The histogram represents the average number of nuclei per cell in three biological replicates. The number of nuclei counted was at least 120 cells for each strain. The nuclei counts for each strain were averaged and error bars represent s.d. from the mean of biological duplicates. Nuclei counts for each strain were compared to that of the wildtype using one-way ANOVA in GraphPad Prism (****P < 0.0001)

