Fig. 1.
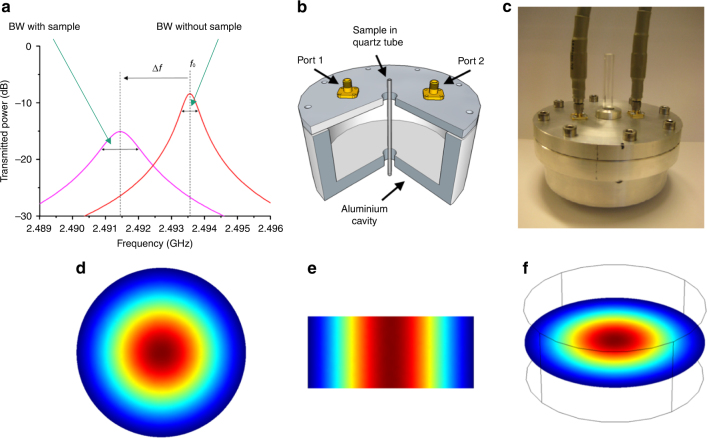
Sets and electric field distribution of the employed microwave cavity. a Schematic of example resonant traces showing the sample induced changes of microwave resonant cavity, which presents a shift in frequency and the change of bandwidth. b Quarter section of the perturbation cavity, cut to show the location of the sample tube (inner diameter 2 mm). c Exterior look of the microwave cavity. d Plan, e side and f slant views of the electric field distribution in the employed microwave resonant cavity

