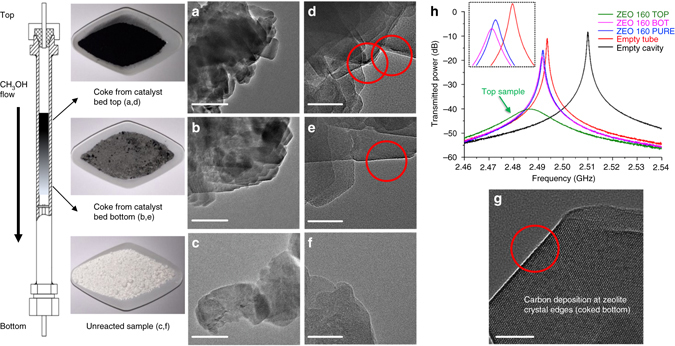
Fig. 2.

Coke depositions of ZEO 160 sample along the catalyst bed shown with their TEM pictures and microwave plots. a–c 200 nm vision transmission electron microscopy (TEM) images of coked top, coked bottom, and un-reacted samples. Overall 50 nm vision TEM images of coked top (d), coked bottom (e) and un-reacted (f) samples. Bulky powders and a schematic representation of the coke depositions in color gradient along the methanol flow route in the employed fixed bed reactor are shown on the left. g Amplified 20 nm TEM image implies carbon accumulation at the zeolite crystal edges. h Captured microwave plots induced by different samples (ZEO 160 group) and conditions. Catalyst unloading started from the reactor top by removing the top nut carefully. Black, deeply-coked samples (top) were collected firstly, until the lightly coked, gray color samples (bottom) emerged. The word BOT in h is an abbreviation for bottom. Scale bar: a–c 200 nm; d–f 50 nm and g 20 nm
