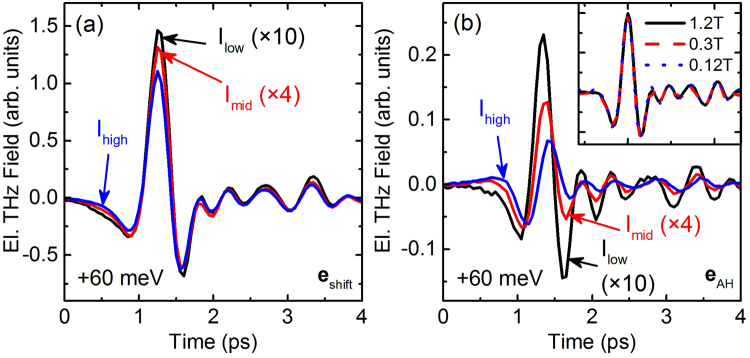
Figure 2.
Measured THz traces emitted from shift currents (a) and AH currents (b) for three different optical peak intensities: I low = 13 MW/cm2 (~4 × 1016 cm−3), I mid = 32.5 MW/cm2 (~1017 cm−3), and I high = 130 MW/cm2 (~4 × 1017 cm−3) with the number in the brackets denoting the optically induced carrier density. The THz traces have been scaled according to the optical intensity, such that an amplitude decrease denotes a sublinear intensity dependence. Inset: Measured THz traces emitted from AH currents for different magnetic fields but fixed optical intensity. The THz traces have been scaled according to the magnetic field. The excitation photon energy was 1.476 eV, i.e., 60 meV above the bandgap of GaAs.

