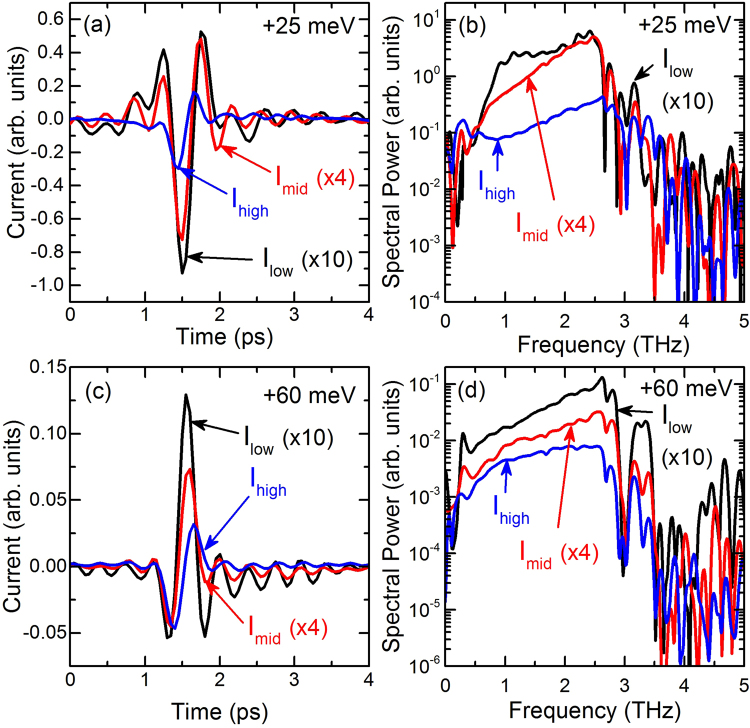
Figure 3.
Extracted shapes of AH currents for three different optical intensities and 2 different photon energies. (a) 1.442 eV, i.e., 25 meV above the bandgap of GaAs, (c) 1.476 eV, i.e., 60 meV above the bandgap of GaAs. (b,d) Spectral amplitudes of the time-domain traces of (a,c), respectively. As in Fig. 2 the time-domain waveforms have been scaled according to the optical excitation intensity and the frequency-domain spectra have been calculated from theses scaled time-domain waveforms.

