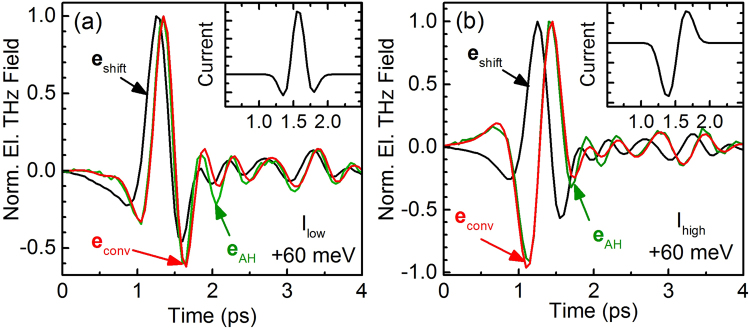
Figure 4.
Measured and normalized THz traces emitted from shift currents (, black lines) and AH currents (, green lines) for two different optical peak intensities: I low = 13 MW/cm2 (a) and I high = 130 MW/cm2 (b) and for an excitation photon energy of 1.476 eV, i.e., 60 meV above the bandgap of GaAs. The red lines () denote the THz traces resulting from a convolution of the current pulses shown in the insets with an inverse Fourier transformation of .

