Figure 5.
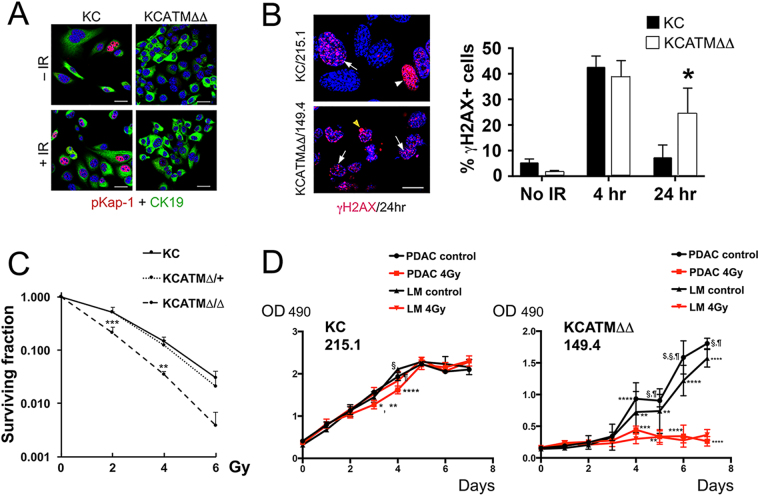
ATM-deficient pancreatic tumor cells are radiosensitive. (A) Immunofluorescence analysis shows induction of phospho-Kap1 expression in KC 215.2 cells 4 hours after 4Gy exposure and lack of this protein in KCATMΔΔ 149.4 cells pre- and post-IR. (B) γH2AX foci increase at 4h and diminish 24 h post-IR treatment (4Gy) in KC 215.2 cultures. In contrast, γH2AX foci persist in KCATMΔΔ 149.4 cultures 24 h post-IR. (A representative γH2AX foci staining is indicated with arrows. The cell showing strong γH2AX staining [arrowheads] is probably apoptotic. *P < 0.05. Error bars represent ± SEM values; n = 3 cell lines, 2-Way ANOVA with Bonferroni’s multiple comparison test). (C) Results of clonogenic assay show comparable viability responses of KC 215.2 and KCATMΔ+ 255.9 tumor cells subjected to different doses of irradiation, and significantly reduced cell viability of KCATMΔΔ 149.4 tumor cells after similar IR treatment. (P values are from KC 215.2 vs. KCATMΔΔ 149.4 cell comparisons; **P < 0.01, ***P < 0.001. Error bars represent ± SEM values of triplicate experiments, 2-Way ANOVA with Bonferroni’s multiple comparison test). (D) Results of MTT assay show slightly reduced cellular response of KC 215.2 tumor cells exposed to 4Gy irradiation (KC 215.1: *P < 0.05 [PDAC 4Gy vs. LM 4Gy]; **P < 0.01 [PDAC control vs. 4Gy]; ****P < 0.0001 [PDAC Gy vs. LM ctrl.]; ¶ P < 0.01 [PDAC control vs. 4Gy]; § P < 0.01 [LM control vs. 4Gy]). MTT results also demonstrate increased sensitization of KCATMΔΔ tumor cells upon 4Gy exposure (day 4, **P < 0.01 [LM control vs. 4Gy]; ***P < 0.001 [PDAC control vs. 4Gy], ****P < 0.0001 [PDAC control vs. LM 4Gy]; day 5, **P < 0.01 [PDAC 4Gy vs. LM control and LM control vs. 4Gy]; §,¶ P < 0.0001 [PDAC control vs. 4Gy and PDAC control vs. LM 4 Gy]; day 6, ****P < 0.0001 [PDAC 4 Gy. vs. LM control and LM control vs. 4Gy]; $ P < 0.05 [PDAC control vs. LM control], § P < 0.0001 [PDAC control vs. LM 4Gy], ¶ P < 0.0001 [PDAC control vs. 4Gy]; day 7, ****P < 0.0001 [PDAC 4Gy. vs. LM control and LM control vs. 4Gy]; § P < 0.0001 [PDAC control vs. 4Gy], ¶ P < 0.0001 [PDAC control vs. LM 4Gy]. PDAC: primary tumor cells. LM: liver metastasis cells. P values are calculated before the cell cultures are confluent. Error bars represent ± SEM values; n = 3 replicates, 2-Way ANOVA with Bonferroni’s multiple comparison test). Scale bars: 25 µm (A), 12.5 µm (B).

