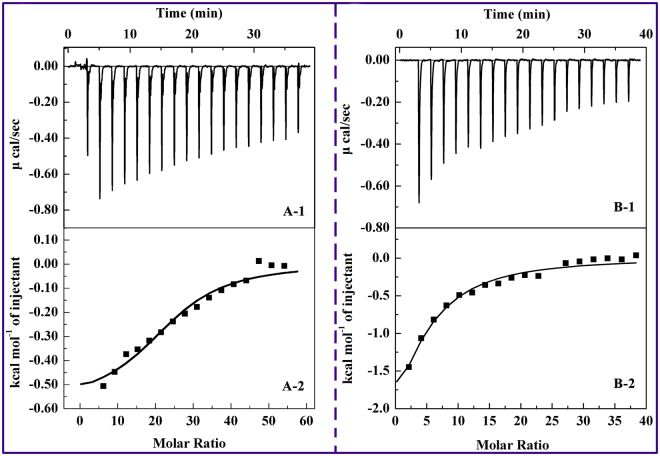
Figure 2.
(A-1) Raw data for the titration of 3 mM BPB with 10 μM HSA at pH 7.4, showing that the calorimetric response as successive injections of BPB is added to the sample cell. (A-2) Integrated heat profile of the calorimetric titration shown in panel A-1. (B-1) Raw data for the titration of 3 mM BPE with 20 μM HSA at pH 7.4, showing that the calorimetric response as successive injections of BPE is added to the sample cell. (B-2) Integrated heat profile of the calorimetric titration shown in panel B-1.

