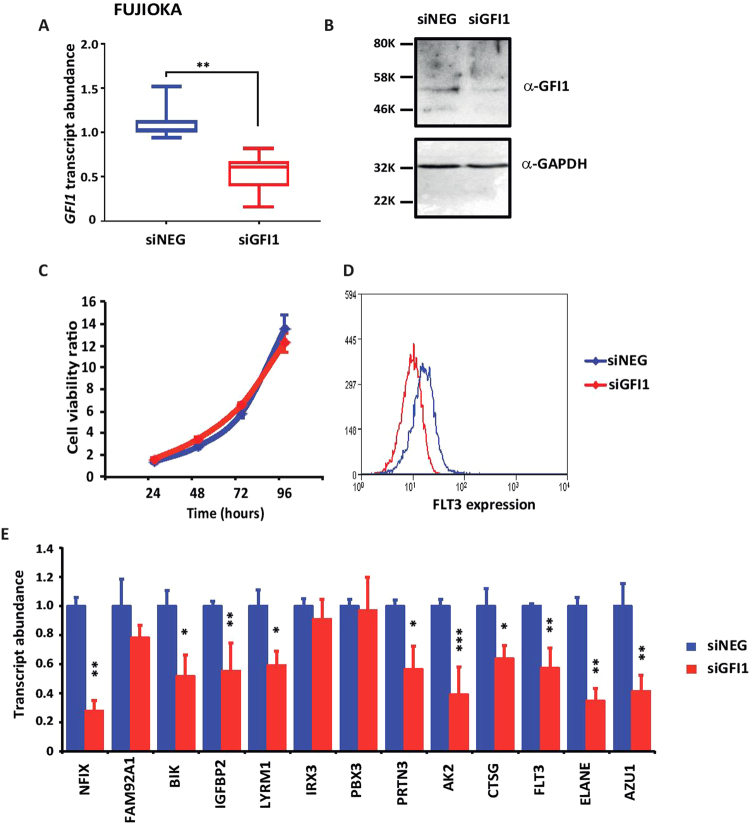
Figure 4.
siRNA-mediated downregulation of GFI1 expression in Fujioka cells (A) GFI1 transcript abundance was determined by quantitative-PCR in cells transfected with GFI1 siRNA and negative control siRNA. Results are representative of 5 independent experiments. Statistical significance was calculated using student’s t-test. ***< 0.001, **< 0.01, *< 0.05. (B) Immunoblot analysis of GFI1 protein in extracts from cells transfected with GFI1 siRNA and negative control siRNA. GAPDH was used as internal control. For detection of GFI1 the membrane was cut into two just below the 46 KDa ladder mark to avoid detection of a cross-reacting non-specific band at around 40 KDa. (C) Cell viability was calculated by counting transfected cells every 24 hours for 4 consecutive days. (D) Flow cytometric staining of transfected Fujioka cells with a labelled antibody against FLT3. (E) RNA quantification by q-PCR of FLT3-ITD molecular signature component 24 hours post siRNA transfection in Fujioka cells. Statistical significance was calculated using student’s t-test. ***< 0.001, **< 0.01, *< 0.05.

