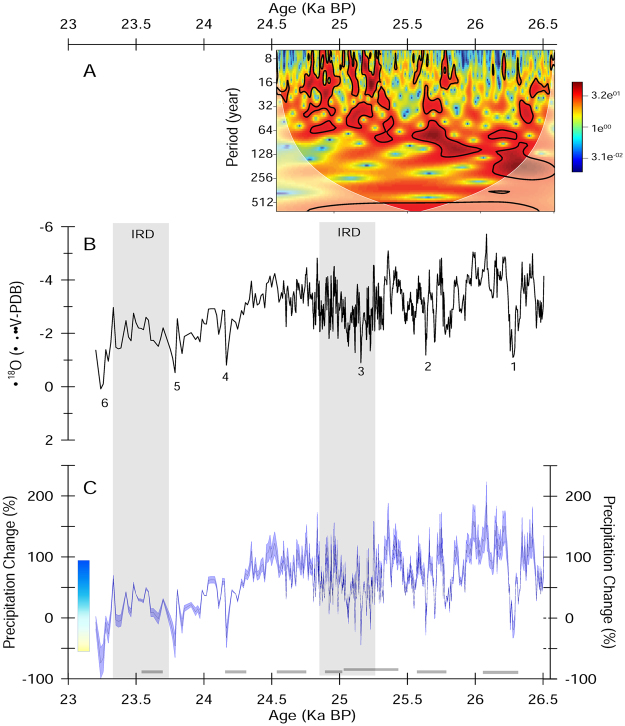
Figure 2.
Itzamna δ18O (panel B) and δ18O-derived precipitation (panel C) records spanning the time interval between 26.4 and 23.2 ka BP from Rio Secreto, Playa del Carmen, Mexico. Precipitation percent change estimates are relative to the mean annual precipitation amount in Playa del Carmen today of 1465 mm (panel B). These records have a resolution during the time interval between 26.5 and 24.6 ka BP of 3.4 ± 1.3 years (1 SD) and between 24.6 and 23.2 ka BP of 16 ± 6.7 years (1 SD). Precipitation change estimates (blue shading) reflect reference values of calcite precipitated under isotopic equilibrium conditions with last glacial dripwater temperature (18–20 °C) and an amount effect (δP/ΔP) ranging from −0.0168‰ per mm to −0.0106‰ per mm, corresponding to the 80% confidence interval of the amount effect slope based on instrumental data (see Methods section for more details). Average precipitation change is indicated by the blue the line within blue shading. Reference equilibrium values were calculated using the paleotemperature equation by ref. 32. The potential bias in our precipitation estimates due to shifts in annual precipitation amount seasonality is ±8% in the range of 55 to 70% summer contribution to annual precipitation (see Methods section). Vertical box on the left of panel B; indicates precipitation variability observed today in the northeast of the YP (mean = 1390 mm per year; range 670 mm to 2664 mm per year), based on the longest continuous instrumental record of precipitation available for this region (i.e. Kantunilkil Station)21. The record covers Stadial 2 and Heinrich event 2 (H2). Vertical grey bars reflect the two peak IRD depositional phases associated with H2, centered at 25 ± 0.2 ka BP and 23.5 ± 0.2 ka BP13. The six significant positive δ18O shifts discussed in the manuscript are indicated with numbers. Top image (panel A), represents a wavelet spectral power analysis of the Itzamna δ18O record. The area outside the white lines indicates the cone of influence where the edge effects of the wavelet transform and uncertainties become important and the black contours reflect statistically significant power spectra (CI = 95%). Wavelet spectral power is based on methods by refs 73, 74, as implemented in the R package “biwavelet”72.

