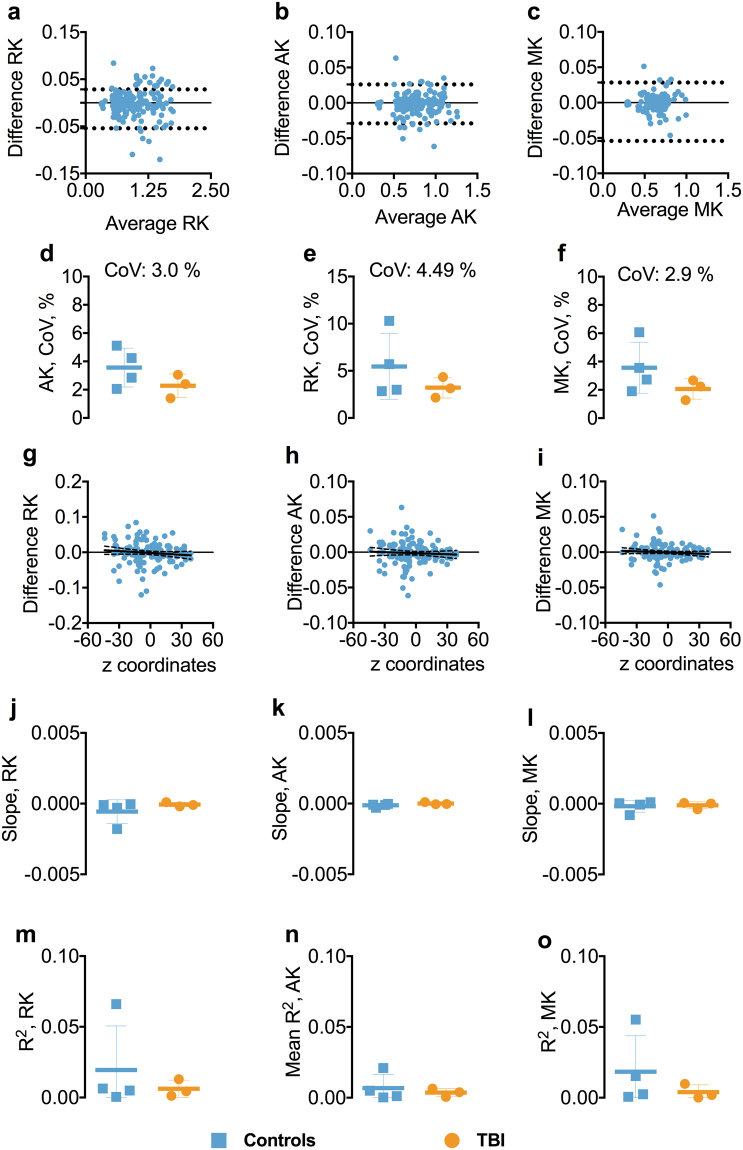
Figure 6.
Test-retest reliability of 1.75 mm isotropic voxel diffusion kurtosis imaging. Panels a–c show the Bland-Altman plots for AK, RK, and MK from one of the participants including the 95% confidence interval for the agreement between scan 1 and scan 2. Each symbol represents a white matter region of interest from the DTI Studio parcellation. Panels d–f show the difference in coefficient of variations (CoVs) for AK, RK, and MK between controls and TBI as well as the overall mean CoV for each diffusion tensor metric. Panels g–i show the slopes of the relationship between z-axis centers and test-retest differences. Panels j–o shows the slopes and R2s including standard deviation for the linear relationships between the AK, MK, and RK and atlas-based white matter tracts in z-axis for controls and TBI separately. Abbreviations: TBI; traumatic brain injury; AK, axial kurtosis; RK, radial kurtosis; MK, mean kurtosis.

