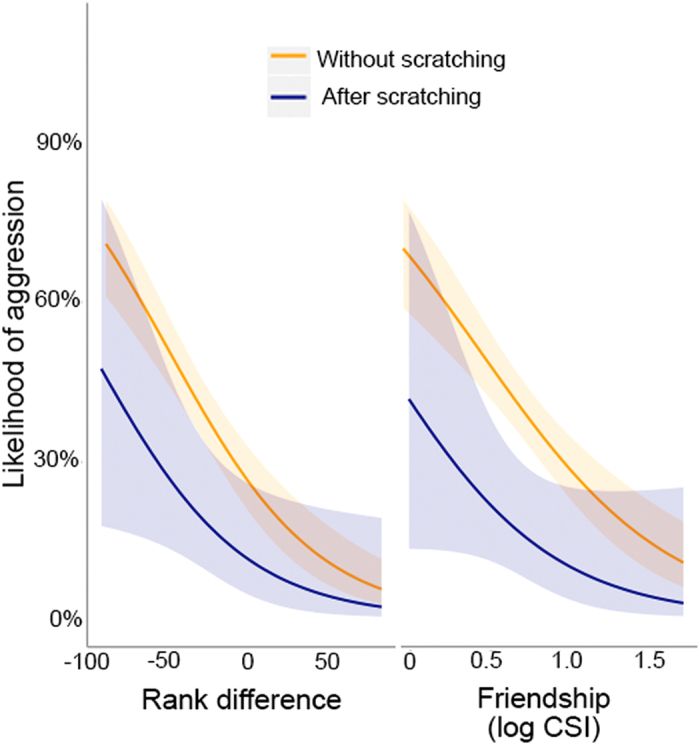
Figure 2.

Likelihood of received aggression post-scratch. This graph shows the probability of a received interaction being aggressive, depending on if it occurred post-scratch or not. Probabilities extracted from models including only the sex of the focal, the factor in question, and random effects. This is compared against the rank difference on the left, and the degree of friendship (log CSI) on the right. A positive rank difference implies the focal is ranked higher than the actor a negative rank difference implies the focal is ranked lower than the actor. A higher CSI represents a stronger social bond. Shaded areas represent 95% confidence intervals.
