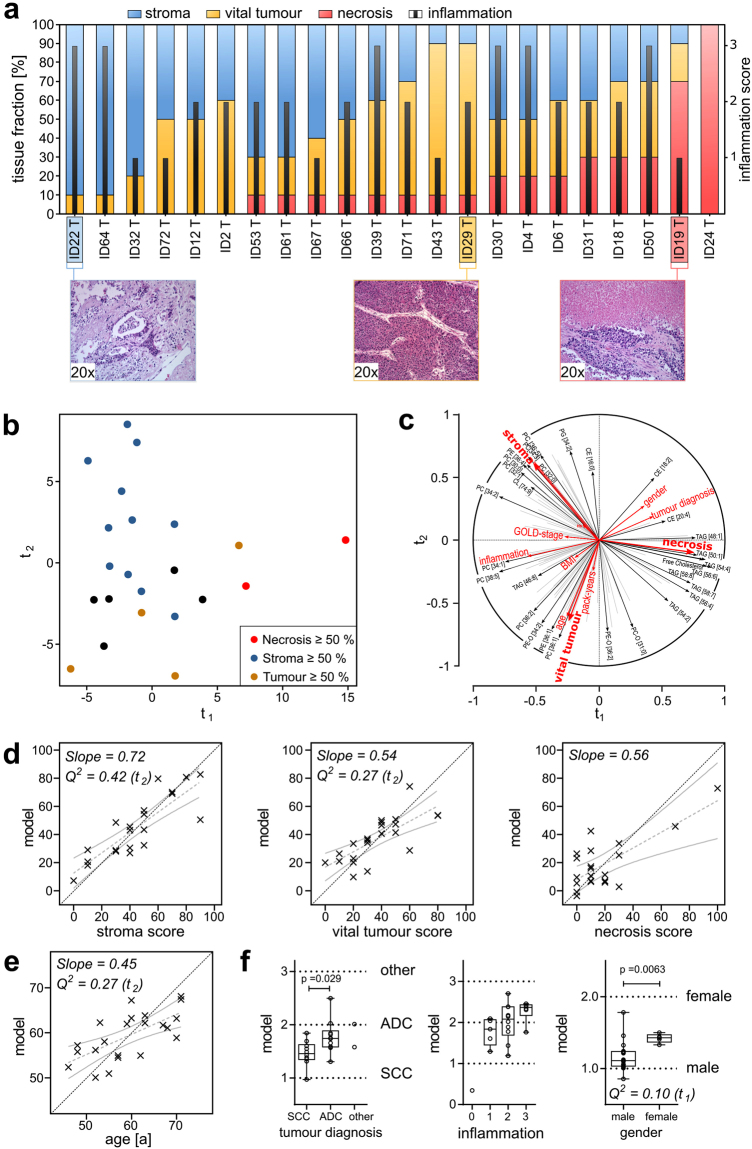
Figure 4.
Factors influencing lung tumour lipidomes analysed by PLS regression. (a) Results of histological scoring. Sections were histologically characterised according to their tissue composition, using percentages of necrotic areas, vital tumour cells and stroma content. The infiltration by immune cells was scored in categories (0, 1, 2, 3). (b) Factor map of individual tumour lipidomes, colour coded according to the dominant tissue fraction (stroma ≥50%, blue; vital tumour cells ≥50%, yellow; necrotic areas ≥50%, red; none of the tissue fractions ≥50%, black). (c) Correlation of lipid quantities, histology scores, and clinical data to the t-components. The vectors indicate how strong the variables correlate to the t-components and show the correlations between the lipidome data (black arrows) and the histology scores and clinical data (red arrows). (d) Correlation of original histology scores to scores computed from the PLS regression model for stroma, vital tumour and necrosis. Linear regressions with 95% confidence bands are shown in grey. The specific slope is noted on the plot. The dotted black line indicates the location of the ideal correlation. (e) Correlation for the clinical parameter age. (f) Evaluation of the PLS regression model for tumour diagnosis, inflammation score, and gender. Boxplots show computed scores versus the original categorical values. Q2 values are the results of the cross-validation of the model. A model is considered significant for a response if Q2 ≥ 0.0975. The associated t-component is noted in brackets after the Q2 value. All p values were calculated using the Mann-Whitney U test. Q2 values and p values are noted only when significance was reached. See also Supplementary Fig. S7.

