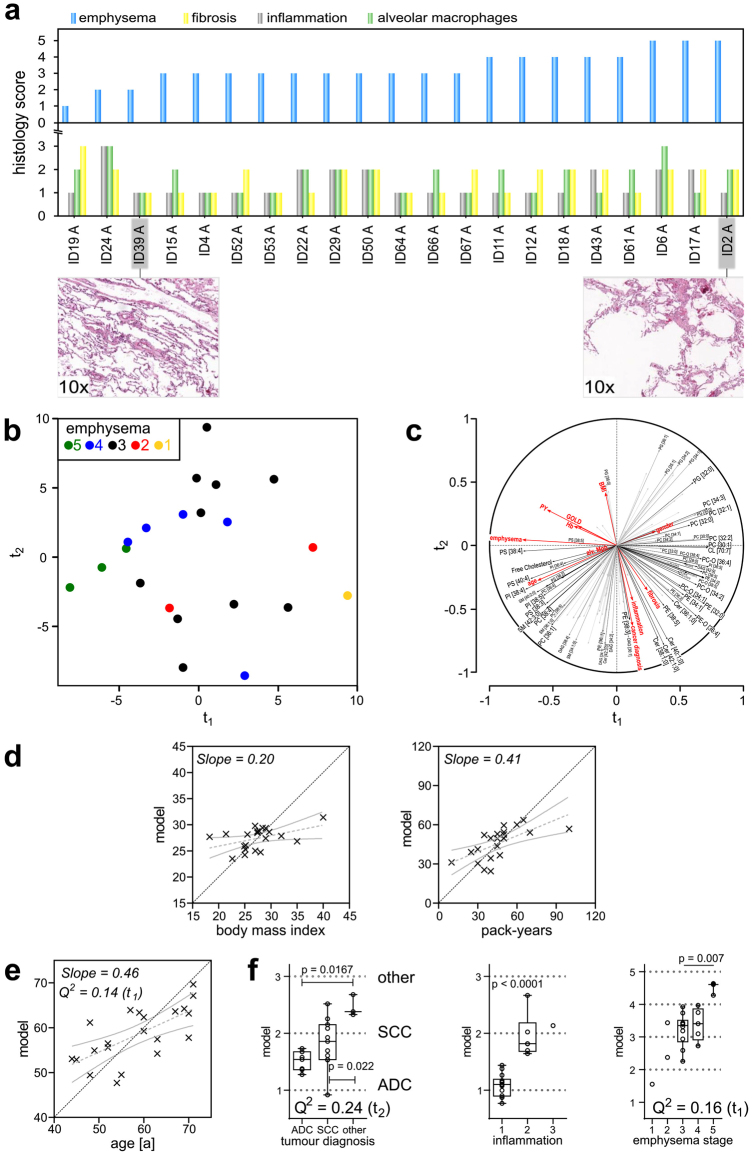
Figure 5.
Lipidomes of alveolar tissues correlate with patient data and histological scores. (a) Histology scores for alveolar control tissues. Alveolar control tissues were scored by inflammation (stages 0, 1, 2, 3), alveolar macrophages (stages 0, 1, 2, 3), emphysema according to Nagai et al.37 and fibrosis (stages 0, 1, 2, 3). The bar graphs show scoring results for every individual tissue, sorted according to increasing emphysema score. (b) PLS regression factor map for alveolar tissue lipidomes. Individuals were colour coded according to their emphysema score. (c) Correlation of lipid quantities, histology scores and clinical data to the t-components. Predictor variables (X) are indicated by black vectors and responses (Y) by red vectors. (d) Correlations of the PLS regression model between original values and computed values for BMI and PY of patients. Grey dotted lines represent the linear fit, and solid grey lines indicate 95% confidence bands. The dotted black line indicates the location of the ideal correlation. (e) Evaluation of the association between age and lipidome. (f) Evaluation of categorical parameters: tumour diagnosis, inflammation status and emphysema stage. Q2 values are the results of the cross-validation of the model. A model is considered significant for a response if Q2 ≥ 0.0975. The associated t-component is noted in brackets after the Q2 value. All p values were calculated using Mann-Whitney U test. Q2 values and p values are only noted when significance was reached.

