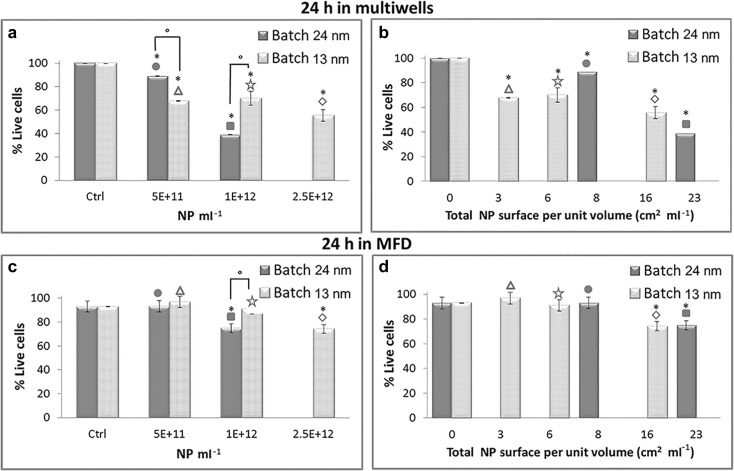
Fig. 6.
Percentage of live cells in multiwells (a, b) or in MFD (c, d) after 24 h exposure to increasing doses of Au NP, assessed by Live/Dead assay. The applied flow rate in the MFD is 5 μl min−1. The data are plotted against NP concentration expressed as number of NP per milliliter (a, c) or against the total NP surface area per unit volume of solution (cm2 ml−1) (b, d). Data represent mean ± standard deviation (2 ≤ n ≤ 4; n is the number of experiments with at least 150 cells counted for each sample). Symbols on the top column help identify the different NP solutions as reported in Table 1. *p < 0.01, t test treated vs. control cells; °p < 0.01 t test batch 24 nm vs. batch 13 nm. p < 0.01 (t test) also between 3 cm2 ml−1 multiwells and MFD (∆); p < 0.01 (t test) also between 6 cm2 ml−1 multiwells and MFD (☆); p < 0.01 (t test) also between 16 cm2 ml−1 multiwells and MFD (◊); p < 0.01 (t test) also between 23 cm2 ml−1 multiwells and MFD (■)

