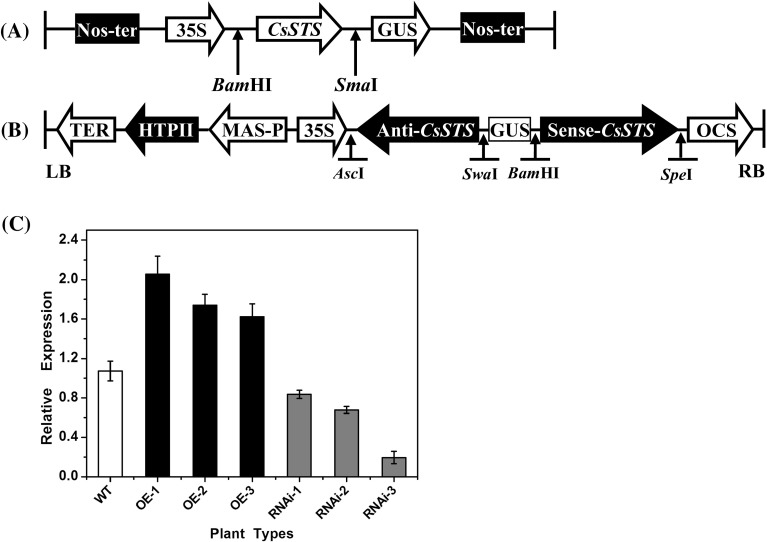
Fig. 3.
Construction of CsSTS-OE and CsSTS-RNAi lines. a Schematic diagram of STS gene over expression vector. b Diagram of the CsSTS-RNAi construct. c The relative expression analyses of CsSTS in WT, CsSTS-OE and CsSTS-RNAi lines by qRT-PCR. TUA in cucumber was used as an internal control, and the experiments were repeated in three intervals. WT wild-type, OE over expression lines; RNAi RNAi lines. Error bars indicate standard deviations

