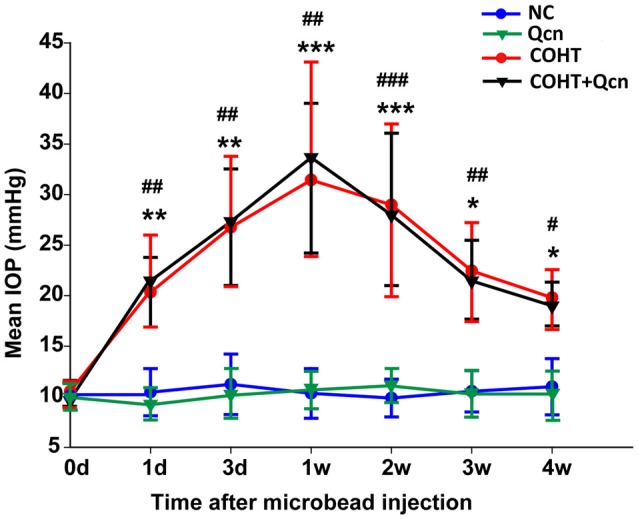
Figure 1.

Mean intraocular pressure (IOP) of rats in the NC, quercetin (Qcn), chronic ocular hypertension (COHT) and COHT+Qcn groups. IOP was observed from 0 weeks to 4 weeks after microbead injection. The data are given as the mean ± standard deviation (SD); #p < 0.05, ##p < 0.01 and ###p < 0.001 for the COHT group compared with the NC group. *p < 0.05, **p < 0.01 and ***p < 0.001 for the COHT+Qcn group compared with the Qcn and NC groups.
