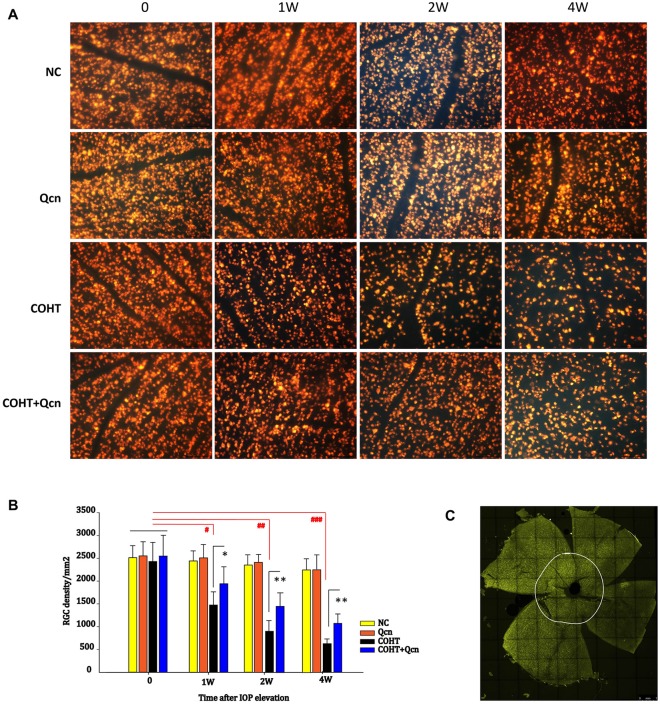
Figure 3.
FluoroGold (FG) labeling of surviving retinal ganglion cells (RGCs) in flat-mounted retinas in the NC, Qcn, COHT and COHT+Qcn groups after 0, 1, 2 and 4 weeks of microbead injection. All images were captured at same magnification. Scale bar, 100 μm (A). (B) Quantification of FG-labeled RGCs. The data are given as the mean ± SD; #p < 0.05, ##p < 0.01 and ###p < 0.001 and *p < 0.05, **p < 0.01. (C) Whole flat-mounted retina. The point on the white circle shows the central position selected for the RGC count.

