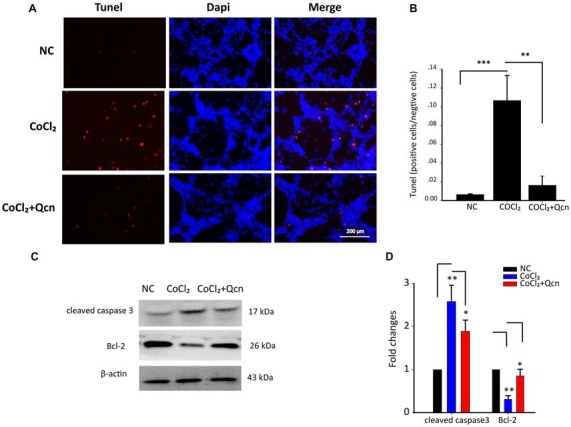
Figure 7.

(A) TUNEL analysis of RGCs from the following three different groups: NC group, CoCl2-treatment group (48 h) and CoCl2 with Qcn-treatment group (48 h). Red indicates TUNEL-positive cells, and blue indicates DAPI. All images were captured at the same magnification. Scale bar, 200 μm. (B) Quantitative analysis of TUNEL-positive cells in retinas from different treatment groups. The data are presented as the mean ± SD; **p < 0.01 and ***p < 0.001. (C,D) Expression of cleaved caspase-3 and Bcl-2 detected by Western blot in RGCs from the following three treatment groups: NC group, CoCl2-treatment group (48 h) and CoCl2 with Qcn-treatment group (48 h). The bars indicate the mean ± SD. β-actin was used as an internal control. *p < 0.05 and **p < 0.01.
