Figure 3.
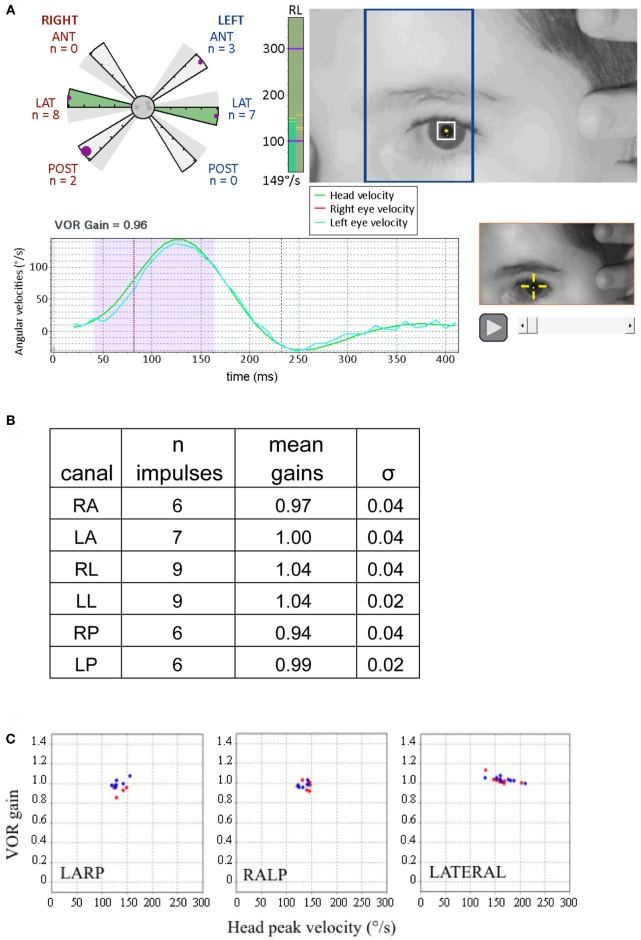
Displays from canal tests of a 9-year-old child with no pathology (adapted from Synapsys® screenshots). (A) Impulses of the right posterior canal [in the left anterior and right posterior (LARP) plane]. (Above right) On-screen real-time video of the patient’s eye to guide the operator for the upcoming impulse. The blue rectangle indicates the plane to guide the operator to rotate the tilted head in order to optimally stimulate the LARP canals. Before applying the head impulse, the clinician can practice rotating the head slowly while viewing the head and the rectangle to confirm that the head movement is indeed in the correct plane. (Lower left) Traces of the head and eye velocities during the most recent impulse performed. The blue trace corresponds to the left eye velocity and the green trace indicates head velocity. The shaded area indicates the data used for gain calculation. (Upper left) The polar style plot with six arms (called a “canalogram”) shows the gains of the impulses already executed as filled circles on the shaded slices. The largest circle corresponds to the head impulse most recently performed. The radial length of the canalogram slice corresponds to a gain of one and zero is the edge of the central circle. The gray dots in the central circle correspond to responses set aside by the program (for example, for blinking). In healthy subjects, many gains have the same values and thus some circles may be superimposed. (Bottom right) Video recording of the most recent impulse. This can be replayed during testing to help identify the cause of possible artifacts. The vertical green column to the right of the canalogram indicates the velocity of the head for the current head impulse in real time. (B) Summary table of results from this subject. (C) The vestibulo-ocular reflex (VOR) gains of this examination are plotted as a function of the peak head velocities of the respective impulses. Note the tight clustering, illustrating the good inter-response replicability (this subject’s gain SD’s for respective canals were all inferior to 0.05). Red diamonds correspond to right canal stimulation and blue diamonds to the left (these plots can be displayed on the screen during the test).

