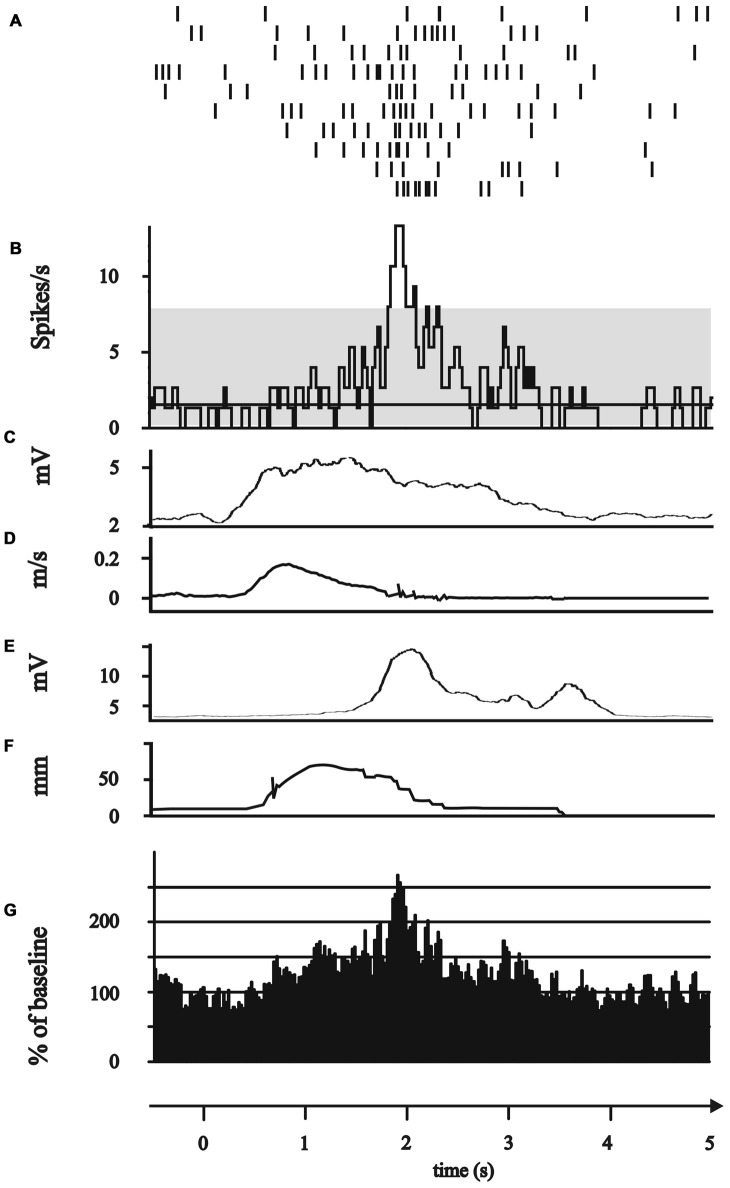
Figure 3.
Modulation of subthalamic neuronal activity during the grip phase. (A–G) All plots represent 0.5 s before to 5 s after the GO/Start signal of the movement. (A–F) Exemplary single neuron recorded of the posterior electrode in 2 mm above the target point. (A) Peri-event raster (bin 0.025 s of neuronal firing of the subthalamic cell during the 10 runs of reach-to-grasp movements. (B) Peri-event histogram of subthalamic activity (bin 0.025 s smoothed with boxcar filter of 3 bin) with confidence interval 95% (gray horizontal bar) of mean expected firing rate. (C) Rectified, smoothed and averaged EMG activity of right deltoid muscle. (D) Average curve of the velocity profiles of the Zebris marker attached to the hand wrist. (E) Rectified, smoothed and averaged EMG of the first dorsal interosseus muscle. (F) Profile of the distance between thumb and index finger recorded by Zebris marker. (G) Grand average of all 10 grip neurons.

