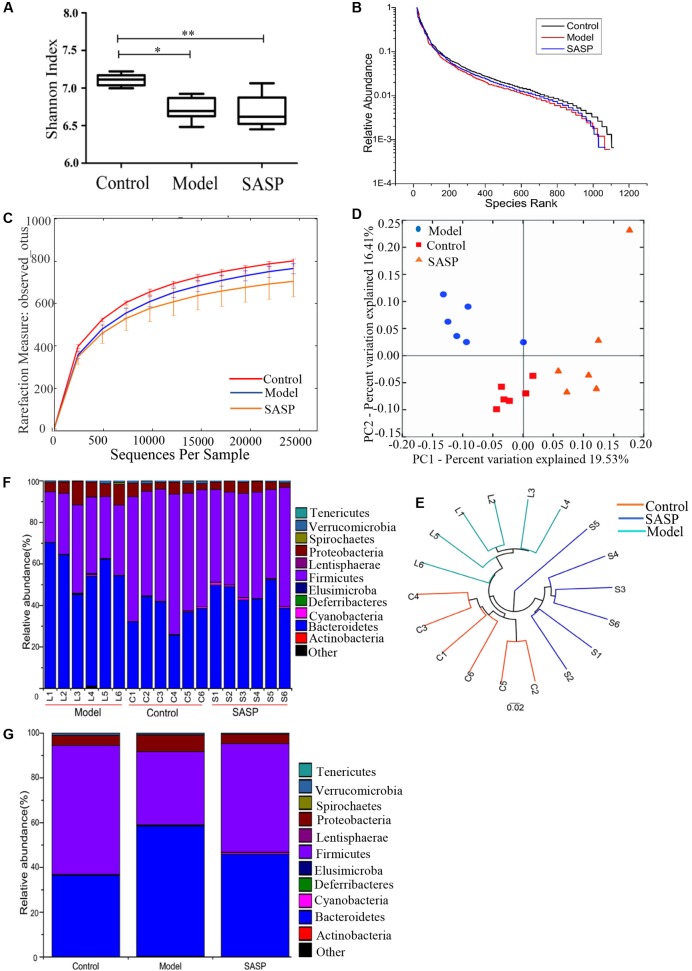
FIGURE 2.
Structural comparison of fecal microbiota among the control group, the model group, and the SASP group. (A) The Shannon index was used to estimate diversity of the fecal microbiota among the three groups (data expressed as mean ± SD). (B) Rank abundance curve of bacterial OTUs among the three groups. (C) The rarefaction analyses-observed_otus could be used to estimate the sequencing depth whether covered rare new phylotypes. (D) Plots shown were generated using the unweighted UniFrac-based PCoA. (E) Multivariate analysis of variance from unweighted UniFrac-based PCoA matrix scores. Bacterial taxonomic profiling in the phylum level of gut microbiota at individual level (F) and different groups level (G). The differences in (A) was analyzed using one-way ANOVA followed by Tukey’s post hoc tests (∗P < 0.05, ∗∗P < 0.01).

