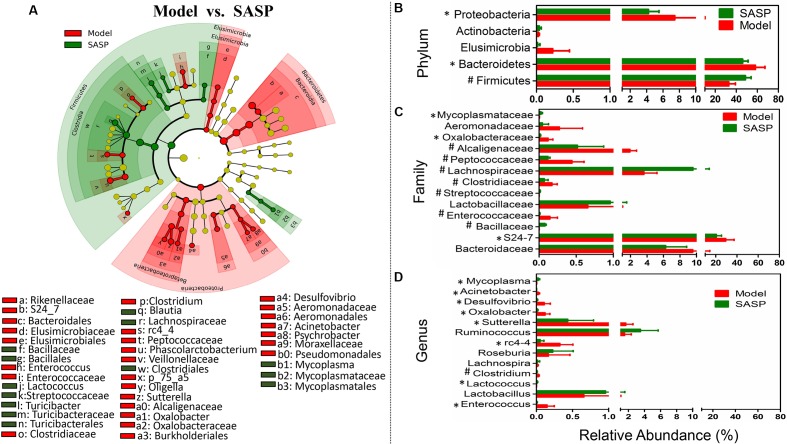
FIGURE 4.
Taxonomic differences of fecal microbiota between the SASP group and the model group. (A) Differentially abundant microbial cladogram obtained by LEfSe, the brightness of each dot is proportional to its effect size. Comparison of relative abundance at the phylum (B), family (C), and genus (D) levels between the SASP group and the model group; all the differences were analyzed using Mann–Whitney U test; ∗P < 0.05; #P < 0.01.

