FIGURE 2.

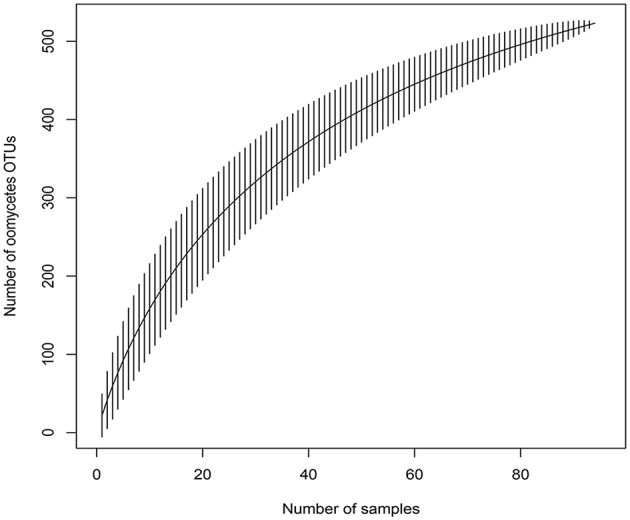
Species accumulation curve for the 96 samples, obtained with the function specaccum of the ‘vegan’ R package; it shows the relationship between observed OTUs and number of samples.

Species accumulation curve for the 96 samples, obtained with the function specaccum of the ‘vegan’ R package; it shows the relationship between observed OTUs and number of samples.