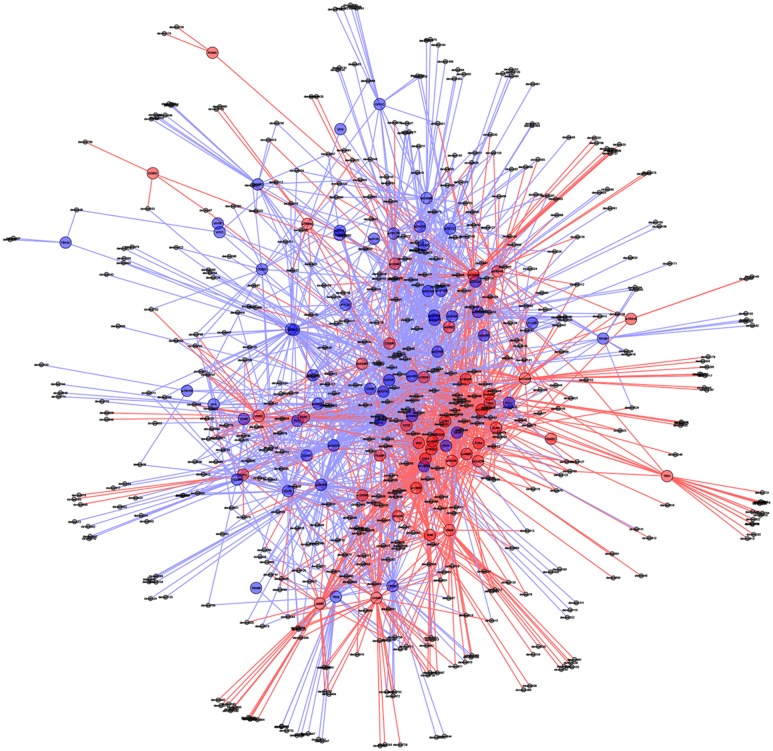
FIGURE 6.
Oomycetes OTU networks in healthy and die-back samples. Larger nodes indicate samples, whereas smaller nodes represent OTUs. All OTUs are connected to the sample to which they belong with a line (edge) making shared OTUs connected to more than one sample. Healthy samples and OTUs as well as lines are indicated with blue, and die-back samples with red. Samples with shared OTUs are located in the center of the plot, while samples with unique OTUs are located in the periphery.

