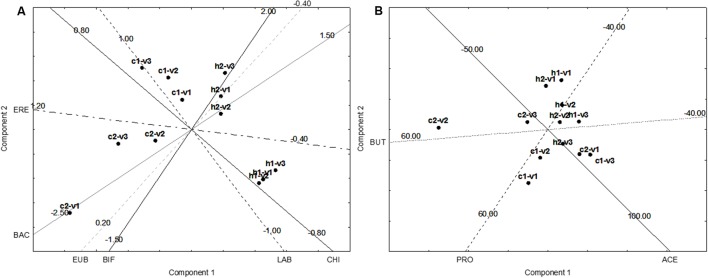
FIGURE 5.
Principal Component Analysis on the increase of FISH counts and SCFA after the supplementation of GFB; the gut models were inoculated with the fecal slurries from healthy (letter H) and celiac donors (letter C). V1, V2, and V3, vessels of the colonic model; 1 and 2, donors 1 or donors 2. The numbers on the projection of the leading variables represent the quantitative data (minimum, central point, or maximum). (A) Effect on FISH counts. LAB, Lactobacillus–Enterococcus (Lab158); BIF, bifidobacteria (Bif164); BAC, Bacteroides–Prevotella (Bac303); ERE, Clostridium clusters XIVa+b (Erec482); CHI, Clostridium group clusters I, II (Chis 150); and EUB, bacteria (Eub 338 I, 338 II, 338 III). (B) Effect on SCFA. BUT, butyrate; ACE, acetate; PRO, propionate. (A) The projection of the variables, whereas (B) reports case projection.

