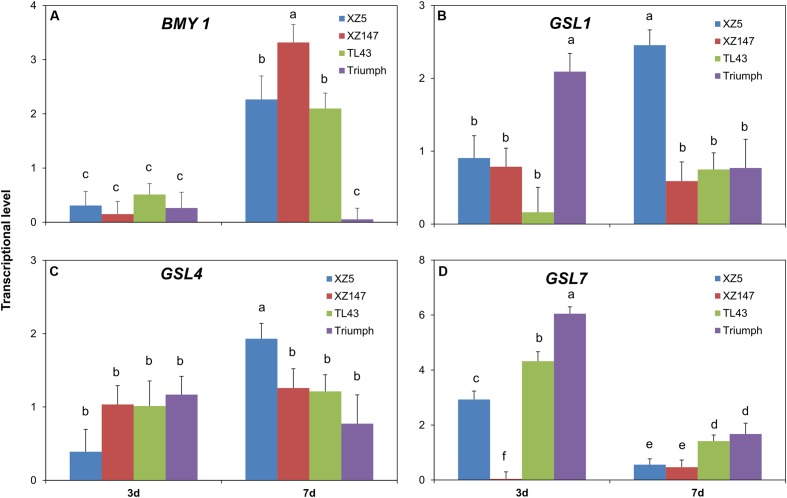
FIGURE 6.
Changes in transcriptional levels of BMY1 (A), GSL1 (B), GSL4 (C), and GSL7 (D) in caryopsis of different barley genotypes after onset of water stress for 3d and 7d. GSLs, β-glucan synthase genes and BMY1, β-amylase gene 1. Different letters indicate the significant difference at 95% probability. Data are mean ± SD.

