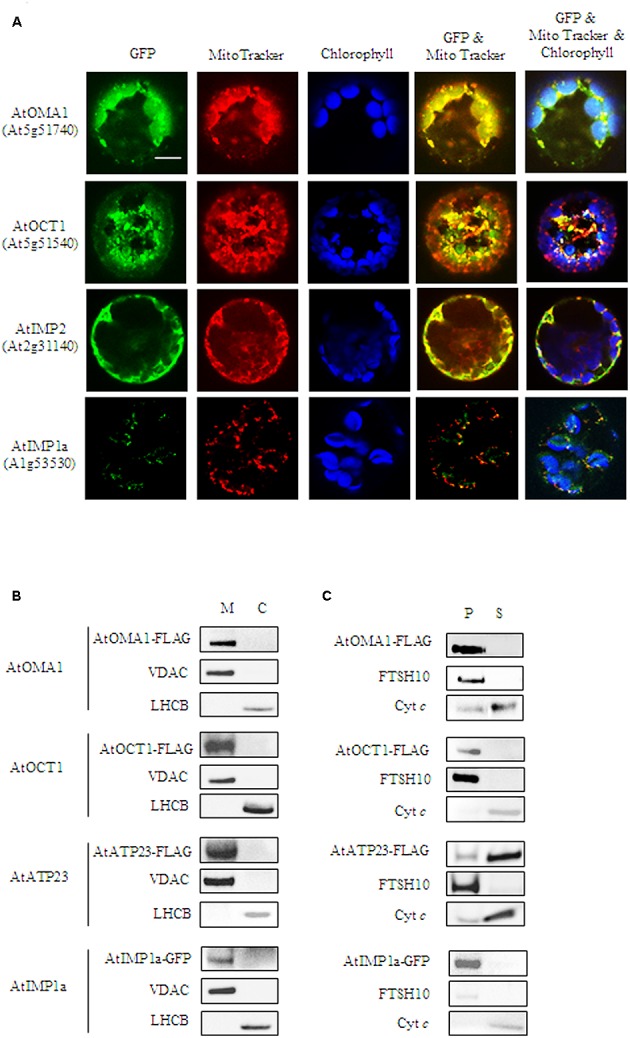
FIGURE 1.

Mitochondrial localization of AtOMA1, AtOCT1, AtIMP1a, AtIMP2, and AtATP23 proteases. (A) Fluorescence imaging of Arabidopsis protoplast expressing the full-length sequence of the protease fused to GFP. The localization of AtOMA1, AtOCT1 and AtIMP2 has been performed using transient expression, while AtIMP1a constitutive expression of the GFP-fusion protein. Mitochondria were detected by staining with Mito Tracker while chloroplast were distinguished by the distribution of their chlorophyll autofluorescence. The fluorescent signals of GFP was merged with Mito Tracker or both Mito Tracker and chlorophyll autofluorescence. Scale bar = 10 μm. (B) Detection of FLAG-tagged AtOMA1, AtOCT1, AtATP23 and GFP-tagged AtIMP1a in mitochondria (M), and chloroplasts (C) isolated from the stable A. thaliana transformants. (C) Fractionation of mitochondria isolated from the stable A. thaliana transformants as in (B). Abbreviations: (S) soluble protein fraction, (P) pellet - membrane protein fraction of mitochondria. Antibodies used in (B,C) were anti-FLAG, anti-GFP, anti-VDAC1-5 (mitochondrial marker), anti-LHCB (chloroplast marker), anti-FTSH10 (marker of mitochondrial inner membrane), anti-Cyt c (Cytochrome c, marker of mitochondrial intermembrane space).
