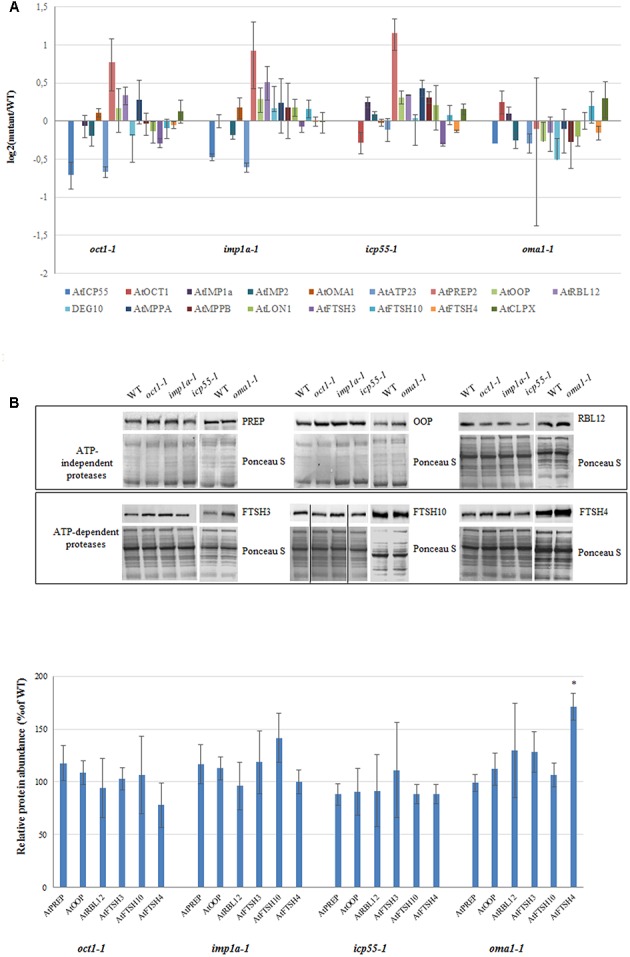
FIGURE 6.

Expression level for selected genes encoding mitochondrial proteases in 4-week-old oct1-1, imp1a-1, icp55-1 and oma1-1 mutants grown under LD, 22°C, compared to wild-type plants. (A) The transcript level of mitochondrial ATP-independent and ATP-dependent proteases. Analysis was performed by quantitative real-time PCR. Relative abundance of transcripts is expressed as log2 ratios. Mean values ± SD from four independent experiments are shown. (B) Abundance of PREP (PREP1 and PREP2), OOP, RBL12, FTSH3, FTSH10 and FTSH4 proteases in mitochondria of WT and studied mutants. Ponceau S serves as a loading control. 30 μg of mitochondrial protein was loaded on gel. Protein amount was quantified densitometrically and values are given as percentage of the value obtained for wild-type plants (set as 100%). Mean values ± SD from three independent experiments are shown. ∗p ≤ 0.05.
