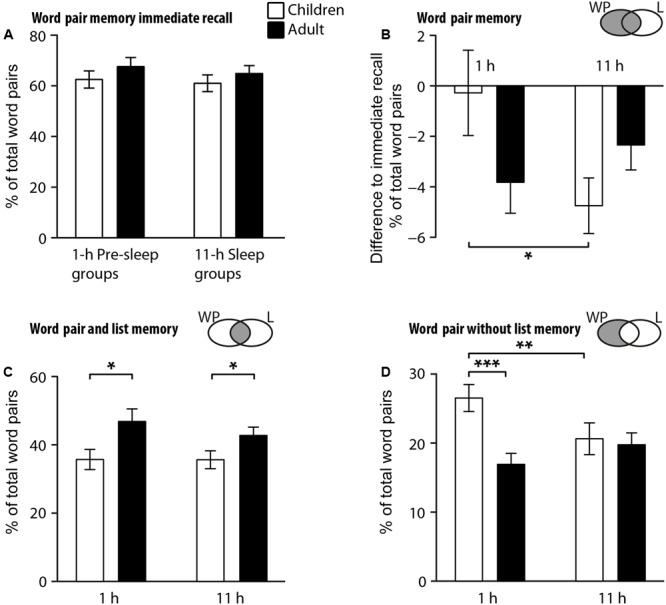
FIGURE 2.

Comparison of recall performance between children (white bars) and adults (black) for the 1-h Pre-sleep condition (left bars) and 11-h Sleep conditions (right bars) for (A) immediate recall of word pairs during the encoding phase (B) delayed recall of word pairs (expressed as the difference from immediate recall as in A), and for subgroups of trials (C) with combined correct word pair and list recall and (D) with correct word pair but incorrect list recall. Recall is expressed as the percentage of the total number of word pairs presented at the encoding phase (40 in children, 80 in adults). Note, recall in (C,D) is not adjusted to the individual’s immediate recall during the encoding phase. Gray area in the Venn diagrams next to the bar graphs depicts the trial category as in Figure 1 with respect to correctness of the delayed word pair (WP) or associated list (L) recall. ∗p < 0.05, ∗∗p < 0.01, ∗∗∗p < 0.001 for pairwise comparisons.
