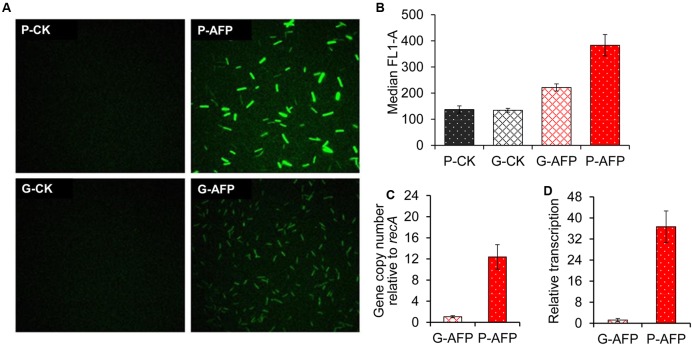
FIGURE 4.
Expression of anaerobic fluorescent protein in the P-AFP transformant and the G-AFP integrant. (A) Fluorescence microscopy of cellobiose-grown cells at the mid-log phase. P-CK and G-CK were corresponding controls of P-AFP and G-AFP that carry the reporter gene in plasmid and chromosome, respectively. (B) Quantification of fluorescent signal intensity with flow cytometry. (C) Relative afp gene copy number in both G-AFP and P-AFP by reference to the single chromosomal recA gene. (D) qRT-PCR comparison of afp transcript levels between G-AFP and P-AFP, with normalization to recA calibrator. Error bar represents the standard deviation of three biological replicates.

