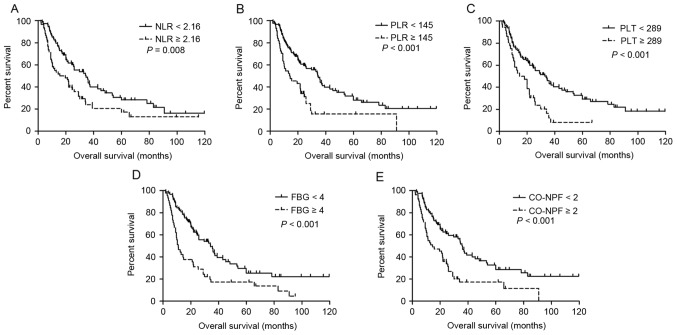
Figure 2.
Kaplan-Meier estimator curves of OS for all patients with adenosquamous cancer. OS rates according to (A) NLR, (B) PLR, (C) PLT, (D) FBG and (E) CO-NPF. OS, overall survival; NLR, neutrophil to lymphocyte ratio; PLR, platelet to lymphocyte ratio; PLT, platelet; FBG, fibrinogen; CO-NPF, combination of NLR, PLR, FBG and PLT.

