
Fig. 3.
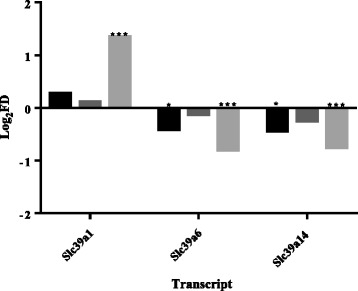
Slc39a transcripts differentially expressed in rat INS-1ab cells following PDX-1 overexpression and IL-1β stimulation. Black bars: PDX-1 overexpression; dark grey bars: IL-1β stimulation; light grey bars: PDX-1 overexpression and IL-1β stimulation. Data analysed from dataset GSE40642. *P < 0.05, ***P < 0.001