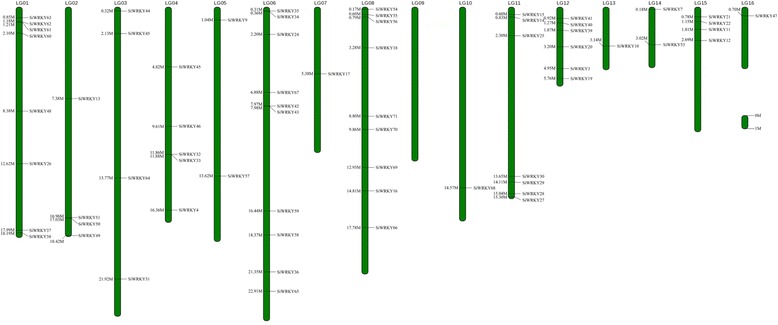
Fig. 1.

Distribution of SiWRKY genes within the sesame linkage group (LG). Vertical bars represent the LGs within the sesame genome. The LG number is indicated at the top of each LG. The scale on the right is in 1 million bases (Mb)

Distribution of SiWRKY genes within the sesame linkage group (LG). Vertical bars represent the LGs within the sesame genome. The LG number is indicated at the top of each LG. The scale on the right is in 1 million bases (Mb)