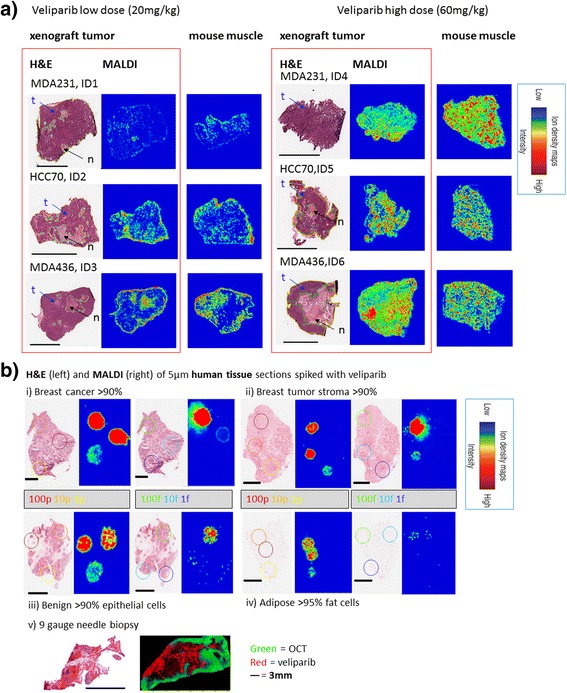
Fig. 2.

Spatial distribution of veliparib in representative examples (a) after low dose (20 mg/kg) and high dose (60 mg/kg) administration using 12-μm-thick tissues from mice xenografted with three triple negative breast cancer cell lines, 3 h after the last dose. H&E (left) and matrix-assisted laser desorption/ionization mass spectrometric imaging (MALDI-MSI) (middle) of veliparib in each xenograft tumor are shown for two mice per cell type. The MALDI-MSI image of the muscle tissue of the same animal (right) is shown for comparison of variability in veliparib distribution between tissues. b Shows that veliparib can be measured in breast cancer tissues (i), stroma tissue (ii), benign tissue (iii) and in 9-gauge core biopsies (v), but the limit of detection is much higher in adipose tissues (iv). The 100p-1p and 100f-1f images were generated using separate intensity scales, allowing the lower concentration spots to be visualized. The colors in the MALDI images represent the veliparib concentration, with blue denoting the minimal signal intensity observed and red denoting maximal signal intensity per image. The regions of interest were derived from the delineated areas in the H&E stains. Yellow, total area of tumor; green, area of frank necrosis (and in some cases adjacent non/hypocellular dropout areas); dark blue, area of frank necrosis and adjacent non/hypocellular dropout areas are also present; aqua blue, spot foci of necrosis and/or apoptosis scattered throughout the tumor. *Mice used for the dynamic contrast-enhanced magnetic resonance imaging (DCE-MRI) pilot; further details are shown in Fig. 5. t = viable tumor cells, N = necrotic cells, scale bar = 3 mm in all tissues
