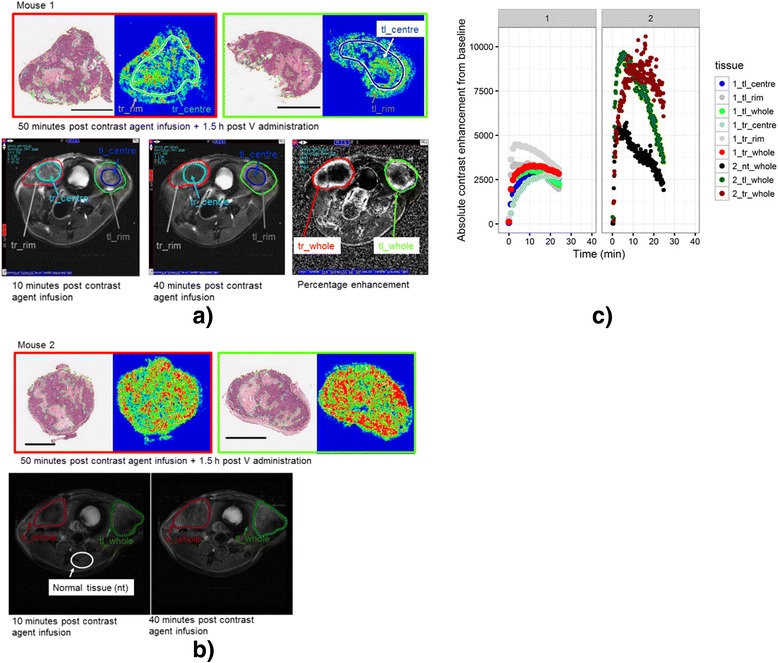
Fig. 6.

Visual comparison of H&E stains and veliparib penetration. Matrix-assisted laser desorption/ionization mass spectrometric imaging (MALDI-MSI) and dynamic contrast-enhanced magnetic resonance imaging (DCE-MRI) images of two HCC70 mice xenografts treated with single-dose 60 mg/kg veliparib + 60 mg/kg carboplatin and euthanized 1.5 h after veliparib/carboplatin (V/C) dosing (a, b). Two implanted xenograft tumors were visualized per mouse. The tumors implanted in the right fat pad is shown in red and in the left fat pad in green (center of the tumor in blue). H&E stains and veliparib MALDI-MSI of the right (red outline) and left (green outline) tumors are shown. DCE-MRI image obtained 10 minutes after infusion of the contrast agent (left) and at 40 minutes (middle and the initial peak enhancement (PE)) (right, mouse 1 only). c The signal intensity-time curves during DCE-MRI after the administration of contrast agent in the two HCC70 mice xenografts (left and right panel) of the right (red) and left (green) tumors (rim in grAy and center in blue), and normal tissue (black). The delineated areas in the H&E stains are: yellow, total area of tumor; green, area of frank necrosis (and in some cases adjacent non/hypo-cellular dropout areas); aqua blue, spot foci of necrosis and/or apoptosis scattered throughout the tumor. nt = normal tissue, tr = tumor right, tl = tumor left
