Figure 1.

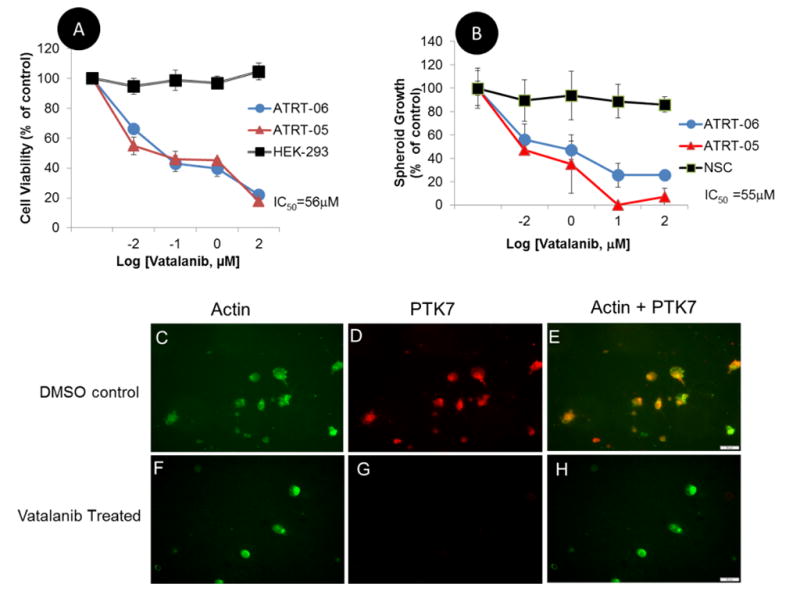
A. Pharmacologically inhibiting protein tyrosine kinases significantly reduces the viability of ATRT cell lines as compared to control HEK 293 cells. ATRT cell lines ATRT-05, ATRT-06 and control HEK 293 cells were exposed to Vatalanib for 4 days. Luminescence in each sample was normalized to a control (no drug exposure treatment) for both ATRT-05 and HEK 293. Cell viability assays were performed using Cell Titer Glo (Promega), and the Ic50 was determined to be 56 μM. Concentrations of Vatalanib ≥ 1.0 μM significantly reduced growth of ATRT cell lines according to a two-tailed heteroscedastic p test, p <0.05.
B. Similarly, Vatalanib exposure inhibited growth of spheroids in ATRT-05 and ATRT-06, but not in control spheroids generated from neural stem cells, with the IC50 for spheroids calculated at 55 μM. Concentrations of Vatalanib ≥ 1 μM significantly decreased growth of ATRT-05 and ATRT-06 spheroids, according to a two-tailed p test, p <0.05.
C–H. Immunofluorescence on ATRT-06 cells. Exposure to Vatalanib for 4 days (F–H) results in a loss of PTK7 immunoreactivity (G, H) compared to ATRT-06 exposed to a DMSO control (D, E). ATRT-06 cells were stained with anti-PTK7 (D, G) and a probe for actin (C, F) in the presence (F–H) and absence (C–E) of Vatalanib (56 μM). While actin staining was present in both Vatalanib-treated (F) and control-treated cells (C), PTK7 expression was only found in control DMSO-treated cells (D, E), and absent in Vatalanib-treated cells (G, H). Panels E and H are merged images of panels C, D and F, G, respectively. E illustrates the expression of PTK7 and actin in DMSO-treated ATRT-06, while H illustrates just actin staining in Vatalanib-treated ATRT-06 (H). Scale bar = 50 microns.
