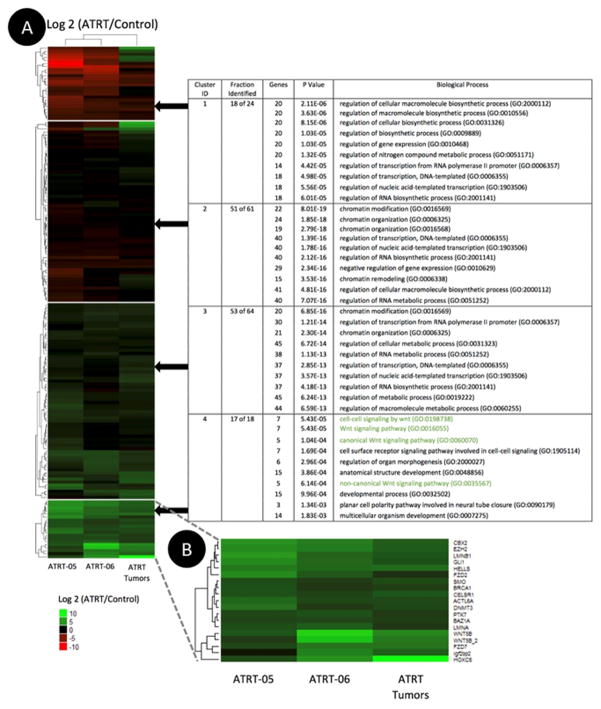
Figure 5.
A. Heatmap illustrating the differential expression of 167 genes and the gene ontology (GO) enrichment analysis associated with each gene cluster. Normalized NanoString expression data from 16 ATRT tumors, 2 ATRT cell lines, termed ATRT-05 and ATRT-06, and 7 neuronal samples were used to calculate the log2 ratio of frozen ATRT tumors or ATRT cell lines to normal frozen neuronal tissue. The 10 GO biological processes with the lowest p values are displayed for each gene cluster. Wnt-related biological processes–highlighted in green–appear only in the analysis for Cluster 4. Very low p values (<0.001) are associated with high significance.

