Figure 6.

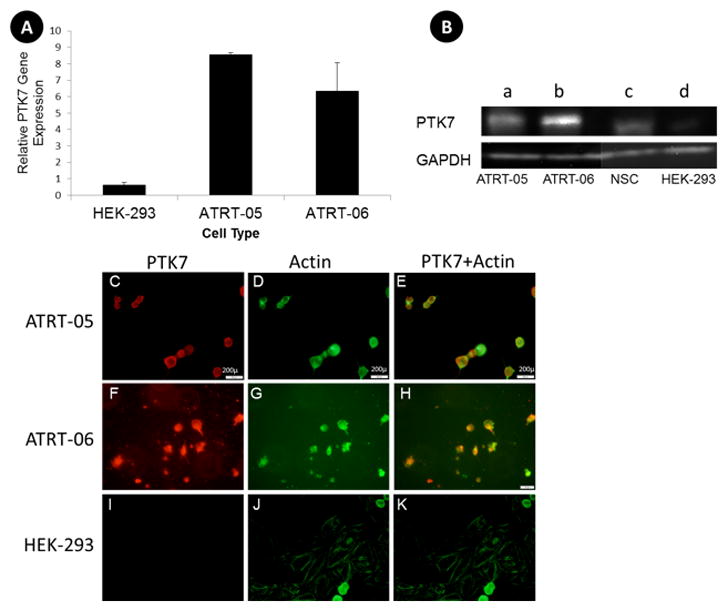
A. RT-PCR indicates increased expression of PTK7 in ATRT tumor cell lines compared to the control HEK cell line, with a p value according to two-tail t test <0.01 (**). One Step PCR was performed on lysates isolated from cells. Primers to GADPH were used to verify equal amounts of sample in each lane.
B. Western blots confirm increased expression of PTK7 in ATRT tumor cell lines (a, ATRT-05), and (b, ATRT-06) as compared to control neural stem cells (c) and HEK 293 (d), with a band corresponding to the full length PTK7 at 118 kD (top panel). Equal amounts of protein (.5μg) were loaded in each lane. HEK 293 served as a non-tumor control sample. Each lane was probed with anti-rabbit-GADPH to verify equal amounts of protein were loaded in each lane (bottom panel).
C–K. Immunocytochemistry confirms an increase in PTK7 expression in ATRT tumor cell lines that is not present in control HEK 293 lines. ATRT cell lines ATRT-05 and ATRT-06 were stained with a monoclonal antibody to PTK7 (red) and with an actin dye (green). The merged images of PTK7 and actin are depicted in E, H, and K. ATRT cell line ATRT-05 stained with PTK7 suggests expression of PTK7 in the cell membranes (C, E), whereas the same cells stained with actin reveals staining throughout the cytoplasm (D). (40x, Scale bar =200 microns). PTK7 expression was also high in ATRT-06 (F, H). No immunoreactivity for PTK7 was observed in control HEK 293 cells (I, K) exposed to anti-PTK7 or in the ATRT cell lines in the absence of primary antibody.
