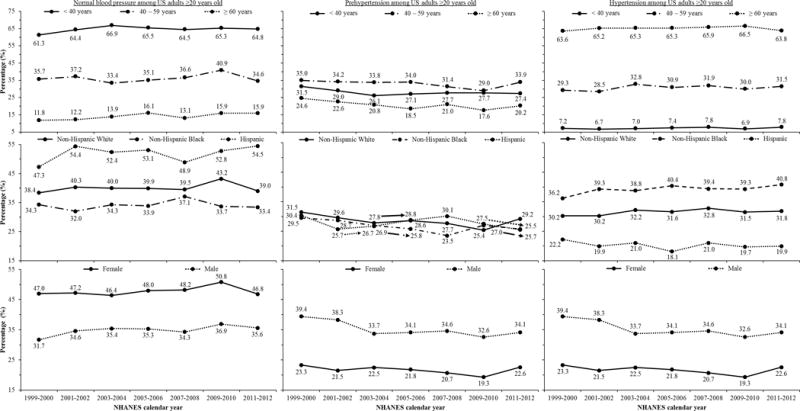
Figure 2.

Age-adjusted percentage of United States adults aged ≥ 20 years with normal blood pressure (left column), prehypertension (middle column) and hypertension (right column) from 1999–2000 through 2011–2012 by age, race/ethnicity and sex.
US: United States.
Arrows indicate the prevalence corresponding with Non-Hispanic Whites, Non-Hispanic Blacks or Hispanics where the plotted values for these race/ethnic groups are difficult to distinguish.
The age-adjusted percentage of United States adults aged ≥ 20 years with normal blood pressure, prehypertension and hypertension from 1999–2000 through 2011–2012 overall is reported in Table S1. Also, the 95% confidence interval corresponding with each point estimate in the current figure, p-trend representing the change in the prevalence over calendar period and the p-interaction representing differences in the change in the prevalence over calendar period across age, race/ethnicity and sex sub-groups is reported in Table S1.
