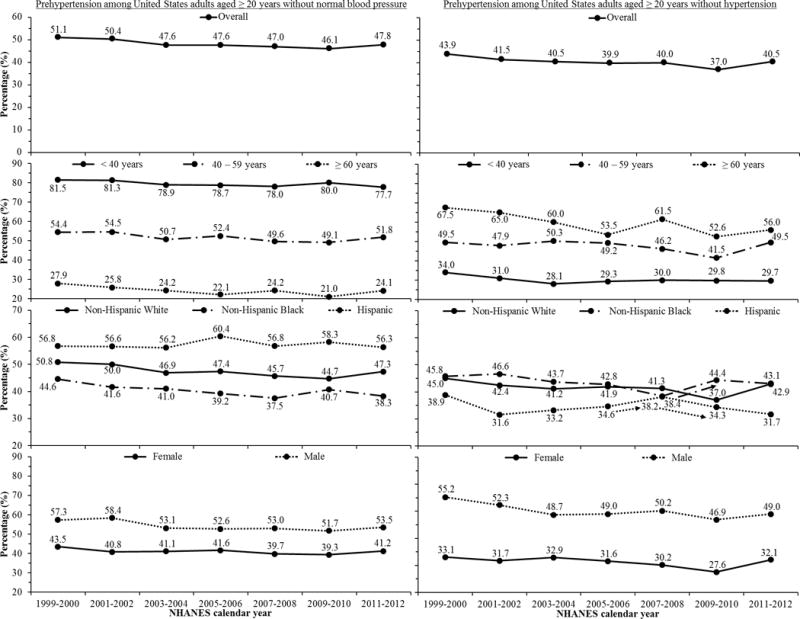
Figure 3.

Age-adjusted percentage of United States adults aged ≥ 20 years with prehypertension in US adults without normal blood pressure (left column) and without hypertension (right column) by National Health and Nutrition Examination Survey (NHANES) calendar year overall and by age, race/ethnicity and sex.
Arrows indicate the prevalence corresponding with Non-Hispanic Whites, Non-Hispanic Blacks or Hispanics where the plotted values for these race/ethnic groups are difficult to distinguish.
The 95% confidence interval corresponding with each point estimate, p-trend representing the change in the prevalence over calendar period and the p-interaction representing differences in the change in the prevalence over calendar period across age, race/ethnicity and sex sub-groups is reported in Table S2.
