
Fig. 1.
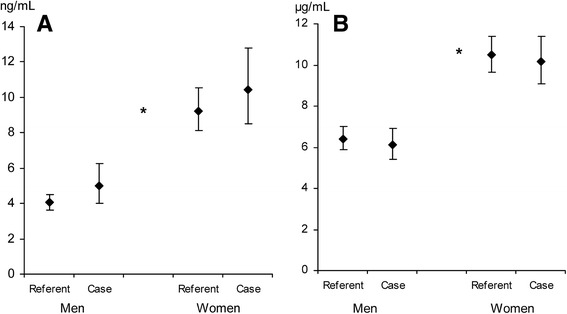
Leptin and adiponectin at baseline survey. Leptin (ng/mL, panel a) and adiponectin (μg/mL, panel b) levels at baseline survey for men and women, cases and referents (55/114 and 95/190, respectively). Data are presented as geometric means with 95% confidence intervals. * p < 0.001 between men and women