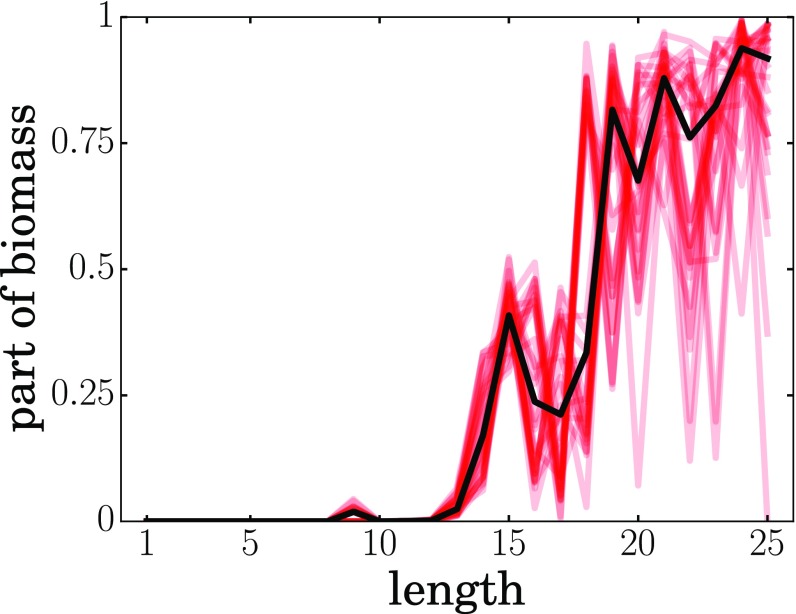
Fig. 9.
The longer the chains, the bigger the contribution of the autocatalysts. Each red line shows how the contribution of autocatalytic chains to the biomass of the given length grows with chain length. Different red lines correspond to different simulation runs. The black line shows the median over 30 simulations.

