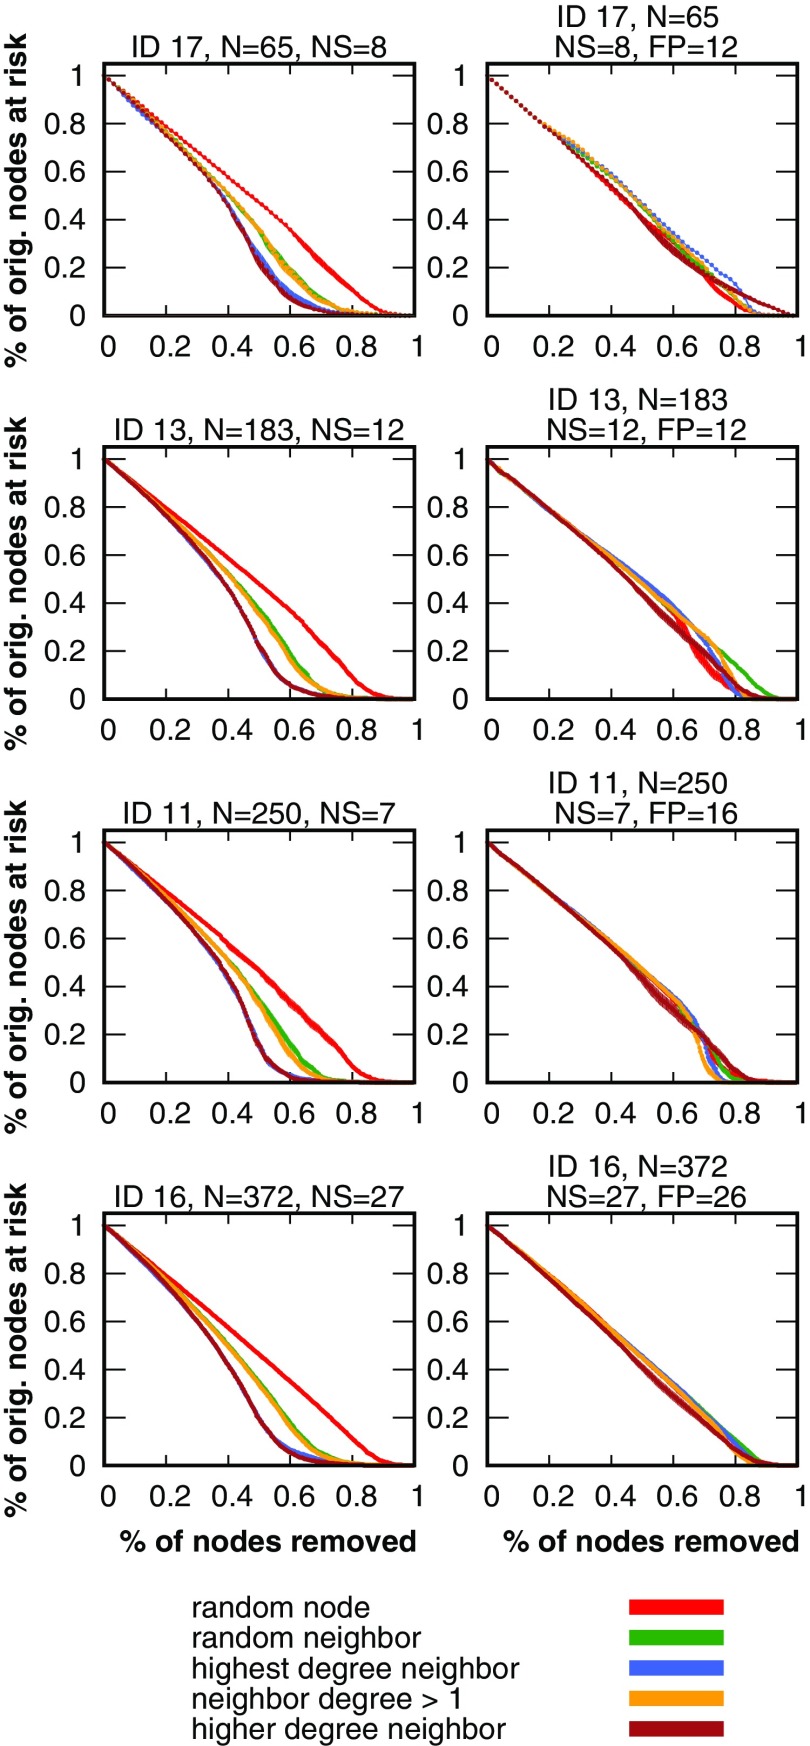
Fig. 6.
Health outcomes for friendship networks. Four villages are shown that had the fewest, median, 75th percentile, and greatest number of nodes. The remaining villages are shown in SI Appendix, Fig. S10. IDs correspond to project-assigned village IDs. N is the total number of nodes in the original network and FP is the total number of FPs in the village. NS is the number of noncompliant seeds; these nodes represent households with someone who refused deworming treatment due to a previous adverse drug reaction. If FP is noted then the FP strategy was used; otherwise, acquaintance and acquaintance-degree strategies were used. Line widths represent 95% confidence intervals.

