Fig. 1.
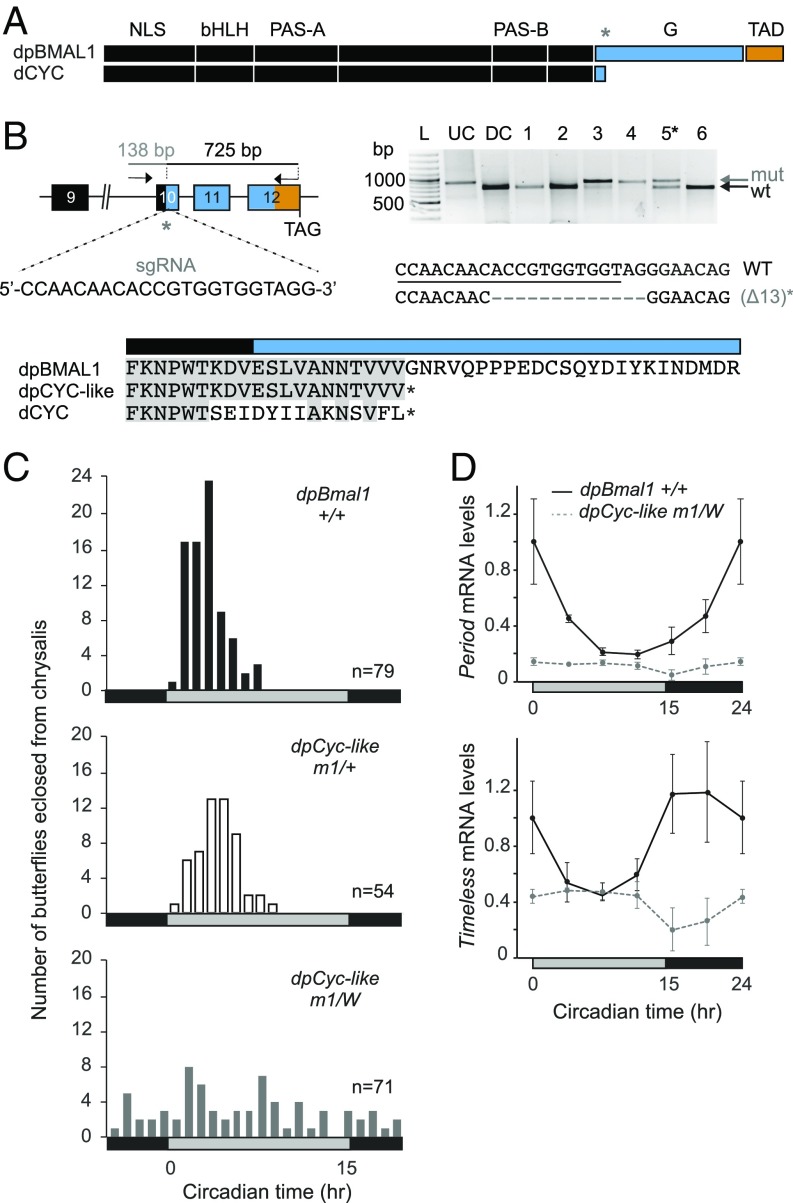
Monarch dpCLK:dpBMAL1 transcriptional activity requires the dpBMAL1 C-terminal domain lacking in Drosophila CYC. (A) Schematic representation of monarch dpBMAL1 and its C-terminal domain (G and TAD) conserved with mammalian BMAL1, lacking in its Drosophila ortholog dCYC. The gray star indicates the position of the single-guide RNA (sgRNA) used to introduce indels. (B, Upper Left) DpBmal1 genomic locus with the sgRNA and the primers used to amplify the 863-bp targeted region for analysis of mutagenic lesions. (Upper Right) Detection of mutagenic lesions (mut) in somatic cells of a subset of potential founder G0 butterflies using a Cas9-based in vitro cleavage assay. DC, digested control; L, ladder; UC, undigested control. The black star indicates the somatic mutant selected for backcrossing to generate a monarch dpCYC-like mutant lacking the BMAL1 G and TAD regions. DpCYC-like mutants carry a 13-bp deletion. (Lower) Partial alignment of dpBMAL1, dpCYC-like mutant, and dCYC proteins showing the position of the truncation in dpCYC-like relative to the C terminus of dCYC. (C) Profiles of adult eclosion in DD of wild-type (black bars), heterozygous (white bars), and hemizygous mutant (gray bars) siblings of the dpCyc-like mutant line (designated “m1”) entrained to 15 h light/9 h dark (LD 15:9) throughout the larval and pupal stages. Data from DD1 and DD2 are pooled and binned in 1-h intervals. The horizontal bars at the bottom of the graphs show subjective day (gray) and night (black). P < 0.0001 (one-way ANOVA); dpBmal1+/+ vs. dpCyc-likem1/+, P > 0.05; dpBmal1+/+ vs. dpCyc-likem1/W, P < 0.01; dpCyc-likem1/+ vs. dpCyc-likem1/W, P < 0.01 (Tukey’s post hoc test). (D) Circadian expression of period and timeless in brains of wild-type (solid black lines) and hemizygous mutant (dashed gray lines) siblings of the dpCyc-like mutant line. Values are mean ± SEM of three animals. The horizontal bars at the bottom of the graphs show subjective day (gray) and night (black). Interaction genotype × time: per, P < 0.01; tim, P < 0.05 (two-way ANOVA).

