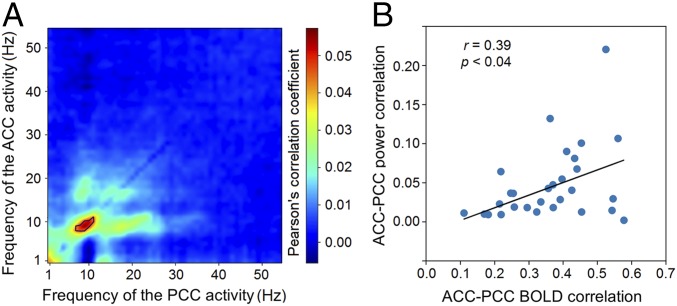
Fig. 1.
MEG connectivity around 10 Hz is associated with fMRI-based connectivity. (A) Heatmap of the temporal correlation between the leakage-corrected power envelopes of MEG sources in the ACC and PCC. Color represents the mean Pearson’s r scores across subjects at each frequency pair. The black line marks significant r scores within the contour that passed the permutation test. (B) Scatter plot of the MEG connectivity around 10 Hz against the fcMRI. Each dot represents a subject, and the regression line is shown in black.

