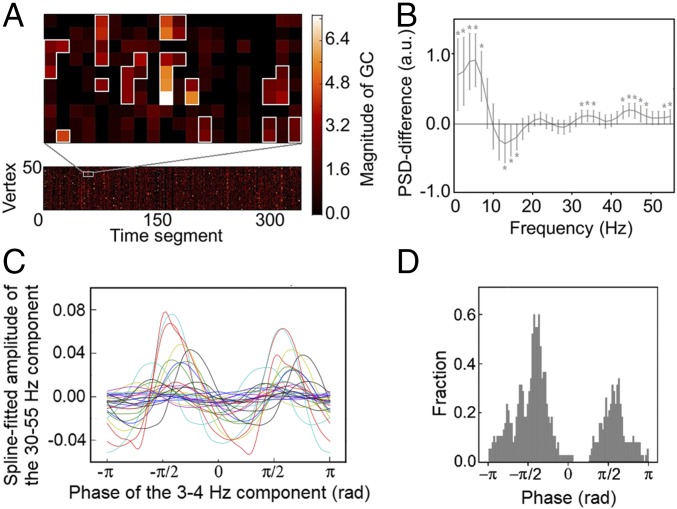
Fig. 3.
Systematic local activity changes associated with the 10-Hz GC fluctuation. (A) Example from one subject showing the spatiotemporal GC clusters within the ACC. The lower plot shows the alpha-band GC from the PCC to each vertex in the ACC across time segments. The plot above is a magnified view showing the spatiotemporal clusters from the chosen part of the lower plot. The vertices are arranged such that those in the clusters are spatially consecutive in the cortical surface. (B) Power difference of the activity inside and outside the clusters, shown as mean ± SEM across subjects. Asterisks denote the significant deviation from zero (*P < 0.05, Bonferroni corrected for 37 comparisons; Table S1). (C) Spline-fitted gamma amplitude over the 3- to 4-Hz phase in the ACC showing peaks around ±π/2. Each line represents one subject. (D) Histogram of the phase angles whose corresponding gamma amplitudes ranked in the top 5%. All subjects were pooled together. The count was standardized by dividing the total counts.

