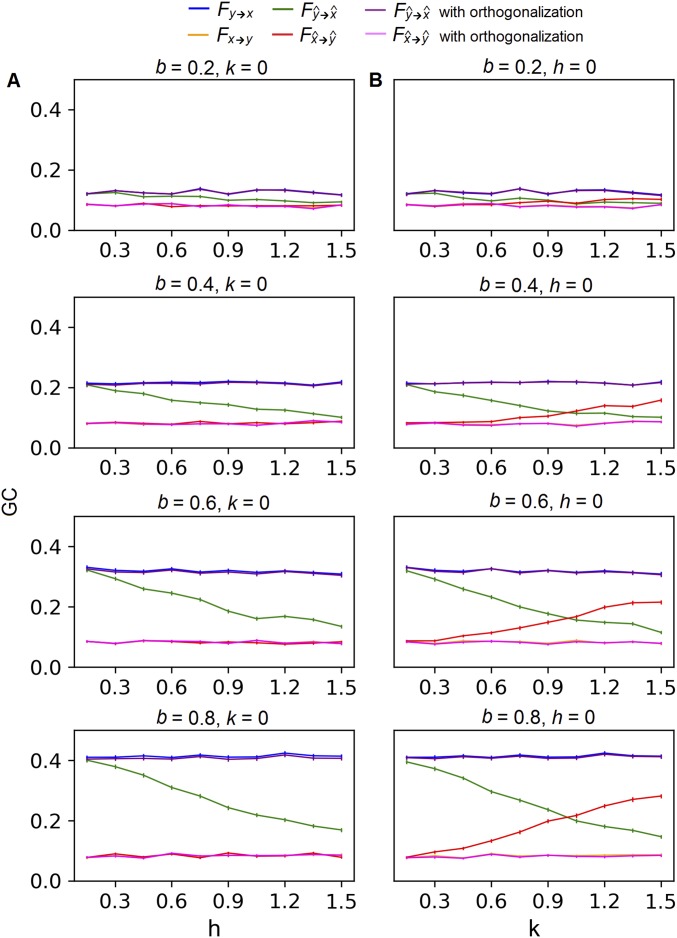
Fig. S4.
GC of the weakly autocorrelated source activity with (A) leakage between two sources x and y and (B) leakage from a third source z into both x and y. All plots share a common legend shown at the Top of the figure. GC was measured by an F score defined in the study by Geweke (49). Each plot shows how F changes with the level of leakage under a single parameter setting. Parameter b controls the strength of the true influence from y to x, while the true influence from x to y was held constantly at zero. Parameter h controls the leakage between x and y, and k controls the leakage from z to x and y. Each curve is an average over 200 runs with the SE across runs.

