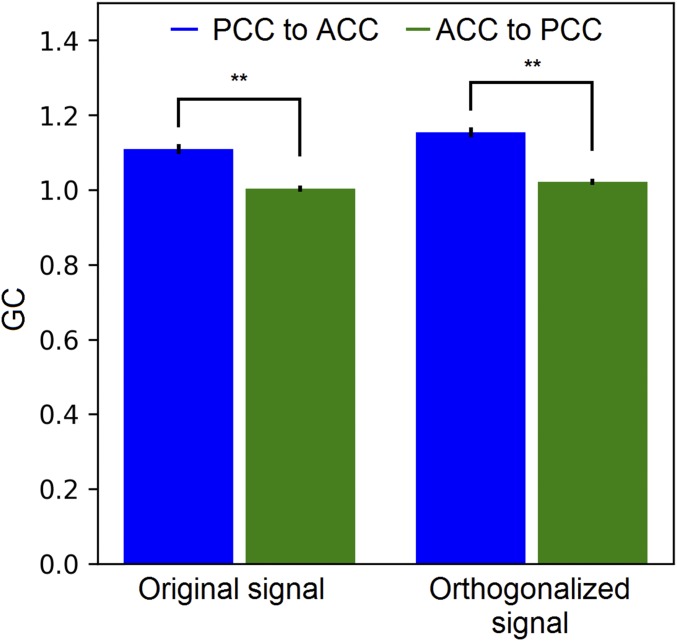
Fig. S6.
GC between the MEG source activity of the ACC and PCC. The orthogonalized signal was obtained using the multivariate regression method in ref. 53, treating the sources of each ROI as one vector. GC was calculated for paired sources between the ROIs, separately for each interheartbeat segment. Each bar is an average across source pairs, segments, and subjects. The error bars represent the SE across subjects. Asterisks represent the significance level of paired t test across subjects (**P < 0.01).

